
Natural Resources Canada
www.nrcan.gc.ca
Common menu bar links
Office of Energy Efficiency Links
Office of Energy Efficiency
Menu
Improving Energy Performance in Canada – Report to Parliament Under the Energy Efficiency Act For the Fiscal Year 2006-2007
PDF Version | Table of Contents | Next Page
Chapter 1: Trends in Energy Use
INTRODUCTION
Canadians enjoy an abundance of energy from a variety of sources. This comparative advantage in the supply of energy helps Canadians deal with the economic disadvantages of small domestic markets, long distances, rugged geography and a relatively harsh climate. It has also fostered the development of industries that have a particularly strong energy demand.
Canadians spent about $152 billion in 2005 on energy to heat and cool their homes and offices and to operate their appliances, vehicles and industrial processes. This amount represents 14.2 percent of the country's gross domestic product (GDP).
ENERGY USE AND GREENHOUSE GAS EMISSIONS
Energy use is categorized in two general types: primary and secondary. Primary energy use encompasses the total requirements for all users of energy, the energy required to transform one energy form to another (for example, coal to electricity) and the energy used to bring energy supplies to the consumer. Secondary energy use is energy used by final consumers for residential, commercial/institutional, industrial, transportation and agricultural purposes.
Primary energy use in Canada today reflects changes over several decades in energy-consuming equipment and buildings and in the behaviour of energy users. Primary energy use increased by 27.0 percent between 1990 and 2005, from 9740 petajoules (PJ) to 12 369 PJ.
Secondary energy use (8475 PJ) accounted for 68.5 percent of primary energy use in 2005. It was responsible for 66.2 percent (495 megatonnes [Mt]) of total greenhouse gas (GHG) emissions in Canada, if indirect emissions are included-namely, those produced by electric utilities to meet end-use electrical demand.
This report deals with energy-related GHG emissions, which comprise carbon dioxide (CO2), methane (CH4) and nitrous oxide (N2O). CO2 accounts for most of Canada's GHG emissions. All subsequent references in this report to CO2 and GHGs include emissions that are attributable directly to secondary energy use and indirect emissions attributable to electricity generation, unless otherwise specified.
From 1990 to 2005, secondary energy use increased by 21.9 percent and related GHG emissions increased by 21.5 percent. The GHG intensity of energy changed during the period because fuel switching towards less GHG-intensive fuels offset an increasing energy demand. The industrial sector is the largest energy user, accounting for 37.9 percent of total secondary energy use in 2005. The transportation sector is the second largest energy user at 29.5 percent, followed by the residential sector at 16.5 percent, the commercial/institutional sector at 13.6 percent and the agriculture sector at 2.5 percent.
ENERGY INTENSITY AND ENERGY EFFICIENCY
Aggregate energy intensity is the ratio of energy use per unit of GDP or, alternatively, energy use per capita. Aggregate energy intensity is sometimes used as a proxy for energy efficiency because it is simple and straightforward and the data for the calculation are readily available. However, this measure is misleading because, in addition to pure energy efficiency, intensity captures impacts such as weather variations and changes in the structure of the economy.
To properly gauge changes in energy efficiency over time, differences in economic structure and weather need to be normalized or factored out of the intensity calculation. Natural Resources Canada's (NRCan's) Office of Energy Efficiency (OEE) applies an internationally recognized factorization analysis technique to isolate the impact of energy efficiency on changes in Canadian energy use.
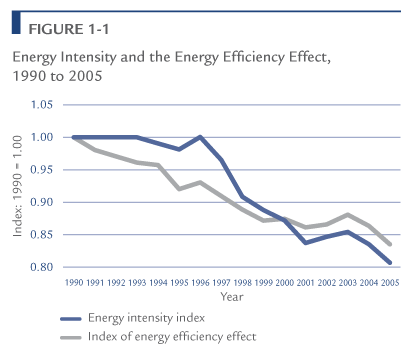
Figure 1-1 compares, for Canada, an index of annual variation in energy intensity with the OEE's index of changes in energy efficiency over the period 1990 to 2005. The indexes present improvements in energy intensity and efficiency as a downward trend.
TRENDS IN ENERGY EFFICIENCY
Every year, NRCan publishes Energy Efficiency Trends in Canada, which reports on changes in energy use (and GHG emissions) and the contribution of the following key factors to these changes:
- Increases in sector activity lead to increased energy use and emissions. In the residential sector, for example, an increase in the number of households results in increased energy use.
- Fluctuations in weather lead to changes in space-heating and space-cooling requirements. A cold winter or a warmer summer can lead to increased energy use.
- A shift in the structure of activity toward more energy-intensive components of activity leads to increased energy use and emissions. For example, if the distribution of activity in the industrial sector shifts from forestry to the iron and steel industry, industrial energy use will increase because the former sector is less energy intensive than the latter.
- A higher service level for auxiliary equipment (for example, computers, fax machines and photocopiers) increases energy use and emissions. During the 1990s, these types of equipment were widely adopted. However, improvements in functionality increased productivity and moderated increases in energy consumption caused by the use of more machines.
- Energy efficiency refers to how effectively energy is being used – for example, how long an appliance can be operated with a given amount of energy.
In this report, changes in energy efficiency are the net result after allowing for the changes in energy use due to changes in activity, weather, structure and service level. To the extent that other factors that affect energy use are not captured, this measure of energy efficiency improvements may overstate or understate the "actual" change. For example, in the industrial sector, in an industry such as other manufacturing, there may have been changes in energy use due to shifts in the mix of products, but this is not captured.
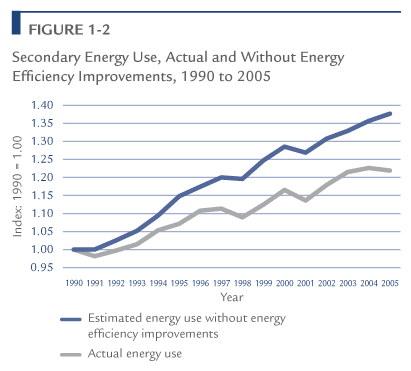
Secondary energy use increased between 1990 and 2005 (from 6952 to 8475 PJ). Without improvements in energy efficiency, increases attributable to activity, weather, structure and service level would have led to an increase in secondary energy use of 37.7 percent. However, as a result of a 15.8 percent (1096 PJ) improvement in energy efficiency,¹ actual secondary energy use increased by 21.9 percent to 8475 PJ.
TABLE 1-1
| Sectors | |||||||
|---|---|---|---|---|---|---|---|
| Res. | Com./ Inst. |
Ind. | Trans. | Total** | % Change |
||
| 1990 energy use (PJ)* | 1286.2 | 867.0 | 2721.8 | 1877.9 | 6952.1 | ||
| 2005 energy use (PJ) | 1402.2 | 1153.0 | 3209.4 | 2501.8 | 8475.1 | ||
| Change in energy use (PJ) |
115.9 | 286.0 | 487.6 | 624.0 | 1523.0 | 21.9 | |
| Explanatory factor (change due to) | |||||||
| Activity | 353.1 | 246.6 | 1166.0 | 750.4 | 2516.1 | 36.2 | |
| Weather | 5.5 | 25.2 | n/a | n/a | 30.8 | 0.4 | |
| Structure | 7.1 | -1.2 | -331.1 | 186.8 | -138.4 | -2.0 | |
| Service level | 71.0 | 91.8 | n/a | n/a | 162.9 | 2.3 | |
| Energy efficiency | -320.9 | -75.4 | -347.3 | -352.4 | -1096.0 | -15.8 | |
| Other factors | -1.01 | 39.2 | 47.7 | 0.7 | |||
*Petajoules
**Total also includes energy use for agriculture (not shown in "Other factors" in table).
The change in energy use between 1990 and 2005, actual and without energy efficiency improvements, is shown in Figure 1-2. The difference in energy use due to energy efficiency – the estimated energy saving – represents a reduction in energy costs of $20.1 billion in 2005 and a reduction in GHG emissions of almost 64 Mt. Changes in energy efficiency are estimated for each of the four major end-use sectors and are presented in Chapters 3 to 6. The energy efficiency improvements were largest in the residential sector (24.9 percent), followed by the transportation sector (18.8 percent), industrial sector (12.8 percent), and commercial/institutional sector (8.7 percent).²
TRENDS IN RENEWABLE ENERGY
Canada is a leader in the production of renewable energy with almost 16 percent of its primary energy supply coming from renewable sources in 2005. Although renewable energy is often associated with electricity, renewable energy sources also produce thermal energy (steam or heat) or transportation fuels. Renewable energy sources in Canada include water, wind, solar, geothermal and biomass.
Canada has a significant renewable electricity supply due primarily to the widespread use of hydroelectricity. In 2005, 60 percent of Canada's electricity generation was provided by conventional and small hydroelectric plants, which generated more than 358 terawatt hours (TWh) of electricity, up from 337 TWh in 2004. Small hydro plants (less than 50 megawatts [MW]), with installed generating capacity of 3401 MW, provided about 2 percent of the total electricity generated in Canada.
Non-hydro renewable sources accounted for an estimated 2 percent of Canada's total electricity generation. Biomass (waste and virgin biomass and landfill gas) is the main non-hydro renewable energy source in Canada, but wind energy is growing rapidly with an increase in capacity from 139 MW in 2000 to 1459 MW in 2006. Solar photovoltaic has also experienced high rates of capacity growth of about 20 percent annually between 1993 and 2006, although starting from a very low baseline. In 2006, there was a total of 20.5 MW of solar photovoltaic systems installed in Canada, an increase of 3.7 MW over the previous year.
¹ Based on the OEE Index.
² The aggregate energy-use data presented in this report are taken from Statistics Canada's Report on Energy Supply-Demand in Canada (RESD). Differences exist between this report and Canada's Emissions Outlook: An Update (CEO Update) concerning the sector allocations of RESD energy-use data. The CEO Update's sector allocation is based on Environment Canada's Trends in Canada's Greenhouse Gas Emissions 1990- 1997, whereas this report uses a definition better suited for energy end-use analysis. Some modifications to the original Statistics Canada data were required and are documented in Appendix A of NRCan's Energy Use Data Handbook, 1990 and 1997 to 2005.