Energy Consumption of Clothes Washers


Key facts
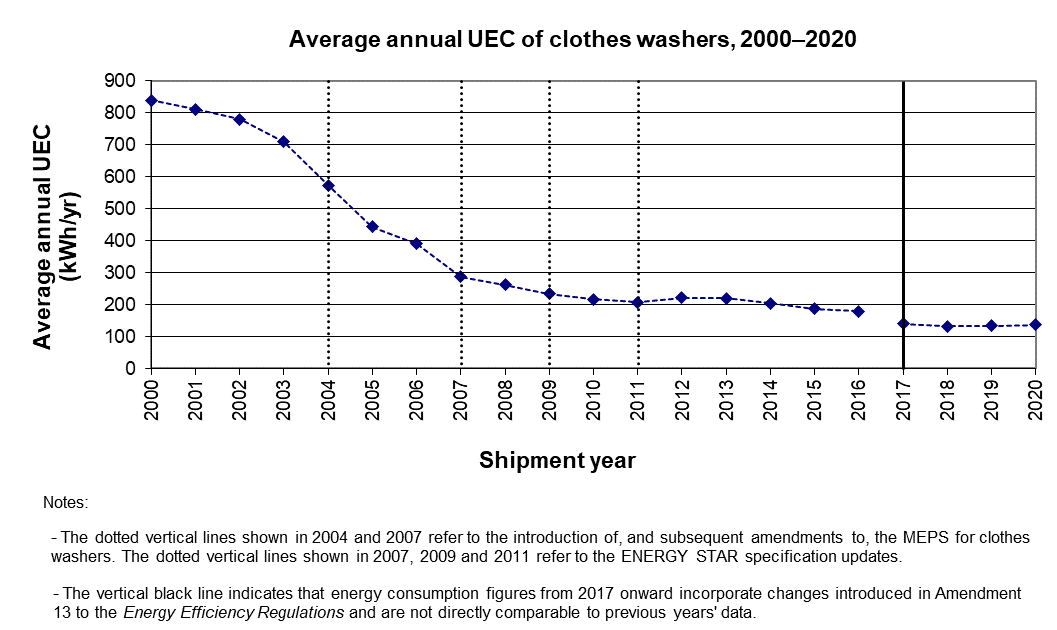
- The average annual unit energy consumption (UEC) of clothes washers decreased 84% between 2000 and 2020, Footnote 1 partly because of the increased demand for front-loading units, which are more energy-efficient than top-loading clothes washers. In 2020, the average UEC of clothes washers was 136.5 kWh/yr. Footnote 2
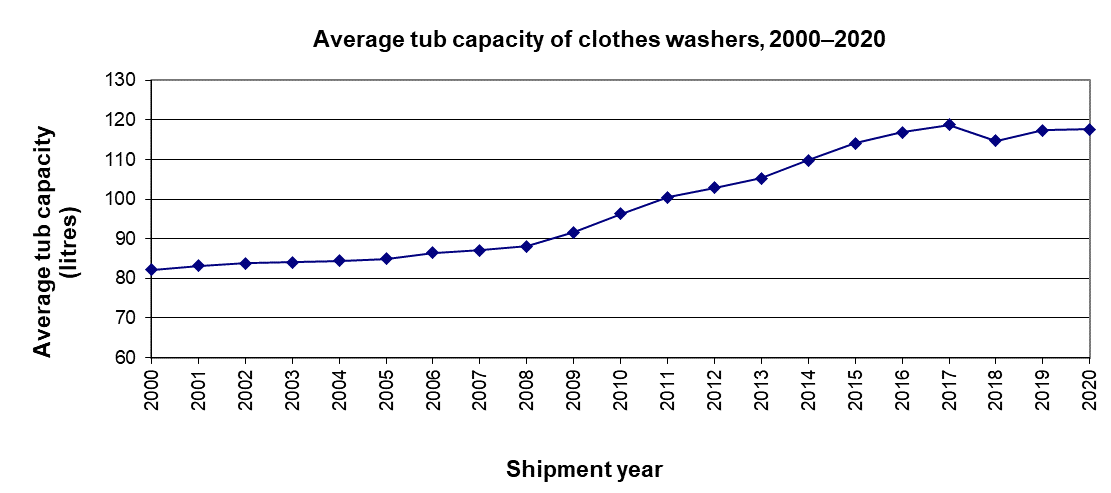
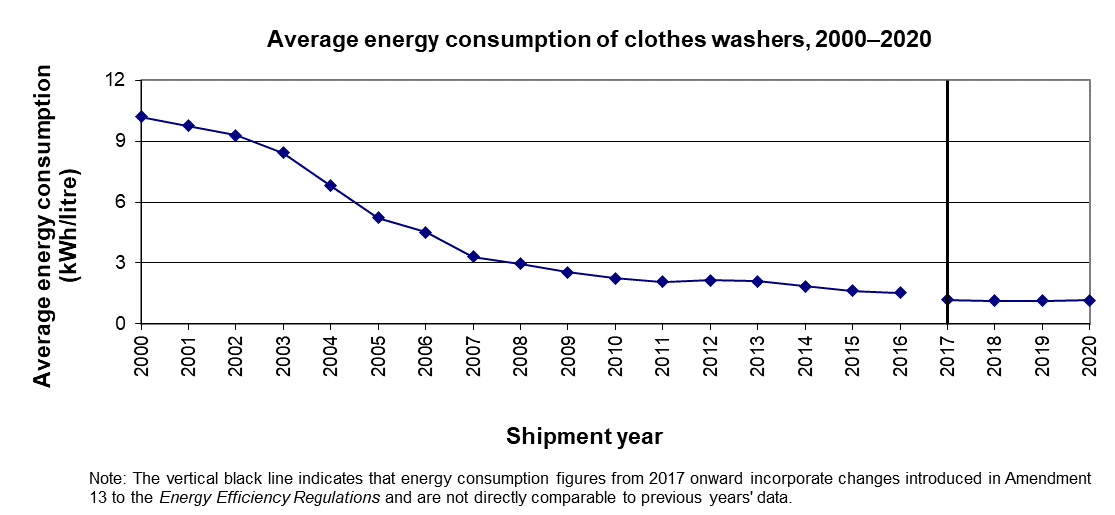
- The average tub capacity of clothes washers increased 43% from 2000 to 2020 Footnote 3 . However, the average energy consumption per litre of tub volume decreased at a much faster rate (89%) during the same period. Footnote 4
- In 2000, 87% of all clothes washers consumed at least 600 kWh/yr. By 2020, 85.3% consumed fewer than 200 kWh/yr. Footnote 5
Average annual unit energy consumption (UEC)
The average annual UEC of clothes washers dropped by 84% between 2000 and 2020. This decrease was due to factors including:
- Energy efficiency improvements, coinciding with the introduction of, and amendments to, the minimum energy performance standards (MEPS) in the Energy Efficiency Regulations,
- Increasing market share of front-loading units, which are more energy-efficient than top-loading units, and
- More stringent MEPS and updated test procedures that came into force in 2017, through amendments to the Energy Efficiency Regulations, as described above.
Text version
Average annual UEC of clothes washers, 2000–2020 (kWh/yr)
| Shipment year | Average Annual Unit Energy Consumption (UEC) (kWh/yr) |
|---|---|
| 2000 | 838.3 |
| 2001 | 810.1 |
| 2002 | 779.2 |
| 2003 | 708.4 |
| 2004 Footnote 1 | 572.9 |
| 2005 | 443.6 |
| 2006 | 389.6 |
| 2007 Footnote 2 Footnote 3 | 287.2 |
| 2008 | 261.5 |
| 2009 Footnote 3 | 233.8 |
| 2010 | 216.8 |
| 2011 Footnote 3 | 207.7 |
| 2012 | 220.7 |
| 2013 | 220.3 |
| 2014 | 204.6 |
| 2015 | 186.3 |
| 2016 | 178.4 |
| 2017 Footnote 4 | 140.3 |
| 2018 | 131.3 |
| 2019 | 134.3 |
| 2020 | 136.5 |
Front-loading versus top-loading washers
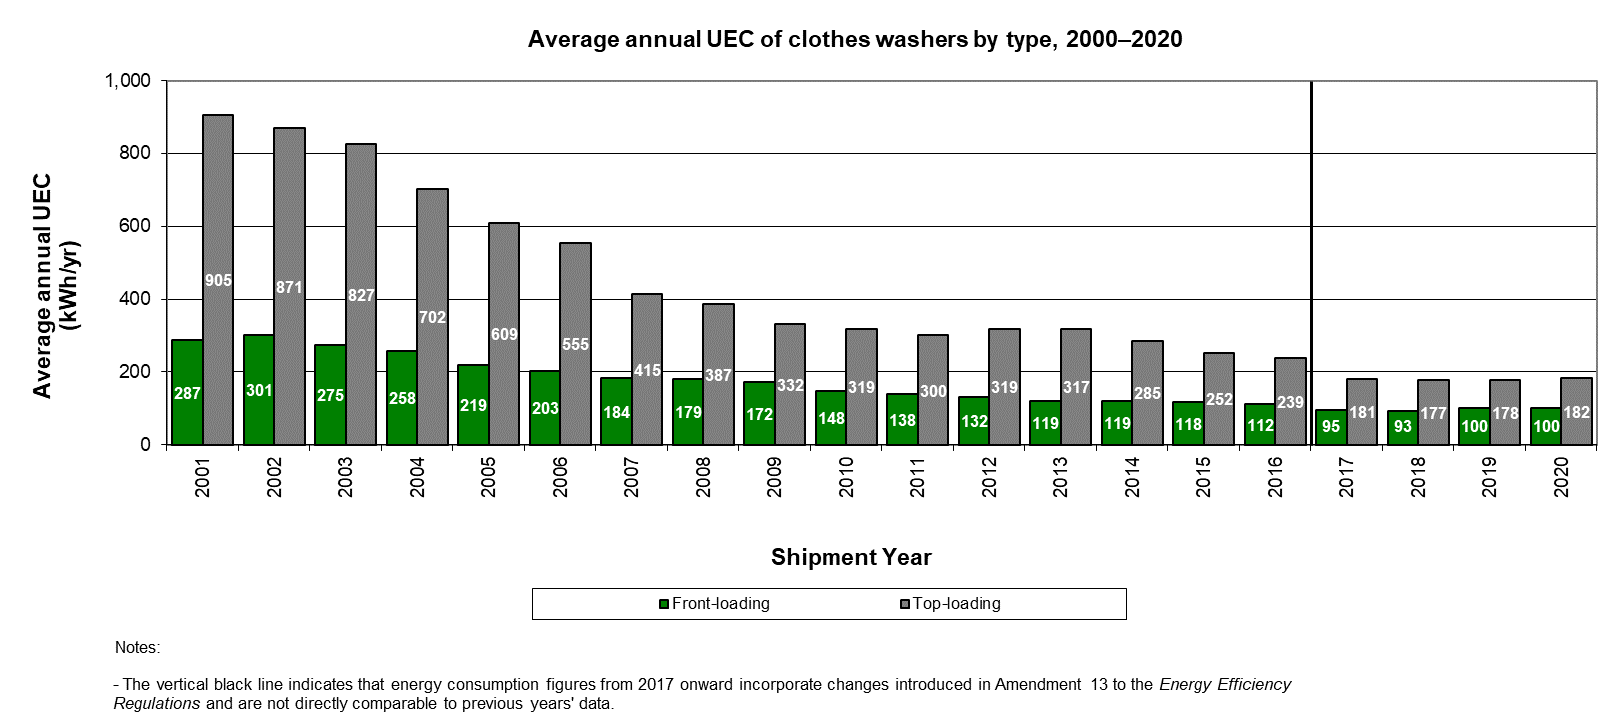
Front-loading clothes washers tend to consume less energy and water than top-loading clothes washers. In 2001, Footnote 6 front-loading clothes washers accounted for only 16% of clothes washer shipments in Canada; by 2020, their market share had grown to 56%.
Top-loading washers have improved substantially in energy efficiency over the years. However, they still consumed almost twice as much energy (on average) as front-loading washers in 2020.
Text version
Average annual UEC of clothes washers by type, 2000–2020 (kWh/yr)
| Shipment year | Front-loading | Top-loading |
|---|---|---|
| 2001 Footnote 1 | 287.0 | 904.7 |
| 2002 | 300.6 | 871.1 |
| 2003 | 274.8 | 826.9 |
| 2004 | 258.4 | 702.3 |
| 2005 | 218.8 | 608.8 |
| 2006 | 202.7 | 555.0 |
| 2007 | 183.9 | 415.1 |
| 2008 | 179.4 | 387.2 |
| 2009 | 172.0 | 331.9 |
| 2010 | 148.3 | 318.7 |
| 2011 | 138.1 | 299.9 |
| 2012 | 131.5 | 319.0 |
| 2013 | 119.3 | 317.2 |
| 2014 | 119.4 | 284.9 |
| 2015 | 117.7 | 251.8 |
| 2016 | 112.2 | 238.5 |
| 2017 Footnote 2 | 94.6 | 181.4 |
| 2018 | 93.1 | 176.6 |
| 2019 | 100.0 | 178.4 |
| 2020 | 100.1 | 182.2 |
Tub capacity
The average tub capacity of clothes washers increased 43% from 2000 to 2020. However, the average energy consumption per tub litre has decreased at a much faster rate during the same period (89%). These changes indicate that consumers are washing substantially more clothes per load and using significantly less energy to do so.
Text version
Average tub capacity of clothes washers, 2000–#nDataYear# (litres)
| Shipment year | Average tub capacity (litres) |
|---|---|
| 2000 | 82.23 |
| 2001 | 83.13 |
| 2002 | 83.85 |
| 2003 | 84.07 |
| 2004 | 84.42 |
| 2005 | 84.98 |
| 2006 | 86.51 |
| 2007 | 87.12 |
| 2008 | 88.16 |
| 2009 | 91.68 |
| 2010 | 96.27 |
| 2011 | 100.47 |
| 2012 | 102.83 |
| 2013 | 105.23 |
| 2014 | 109.83 |
| 2015 | 114.05 |
| 2016 | 116.89 |
| 2017 | 118.75 |
| 2018 | 114.74 |
| 2019 | 117.36 |
| 2020 | 117.60 |
Text version
Average energy consumption of clothes washers, 2000–2020 (kWh/litre)
| Shipment year | Average energy consumption (kWh/litre) |
|---|---|
| 2000 | 10.19 |
| 2001 | 9.75 |
| 2002 | 9.29 |
| 2003 | 8.43 |
| 2004 | 6.79 |
| 2005 | 5.22 |
| 2006 | 4.50 |
| 2007 | 3.30 |
| 2008 | 2.97 |
| 2009 | 2.55 |
| 2010 | 2.25 |
| 2011 | 2.07 |
| 2012 | 2.15 |
| 2013 | 2.09 |
| 2014 | 1.86 |
| 2015 | 1.63 |
| 2016 | 1.53 |
| 2017 Footnote 1 | 1.18 |
| 2018 | 1.14 |
| 2019 | 1.14 |
| 2020 | 1.16 |
Water consumption
Manufacturers have improved the overall water consumption of clothes washers over the years, which has affected their energy use and led to energy savings Footnote 7 . Front-loading clothes washers tumble clothes through a small amount of water, which is different from top-loading clothes washers that rub clothes against an agitator in a tub that is full of water. Advanced top-loading washers flip or spin clothes through a reduced stream of water (instead of filling the entire tub).
| Year | Change 2005 Footnote 8 –2020 |
||
|---|---|---|---|
| 2005 | 2020 | ||
| Average water used (litres per cycle) for each litre of tub size | 1.45 | 0.56 | -61.4% |
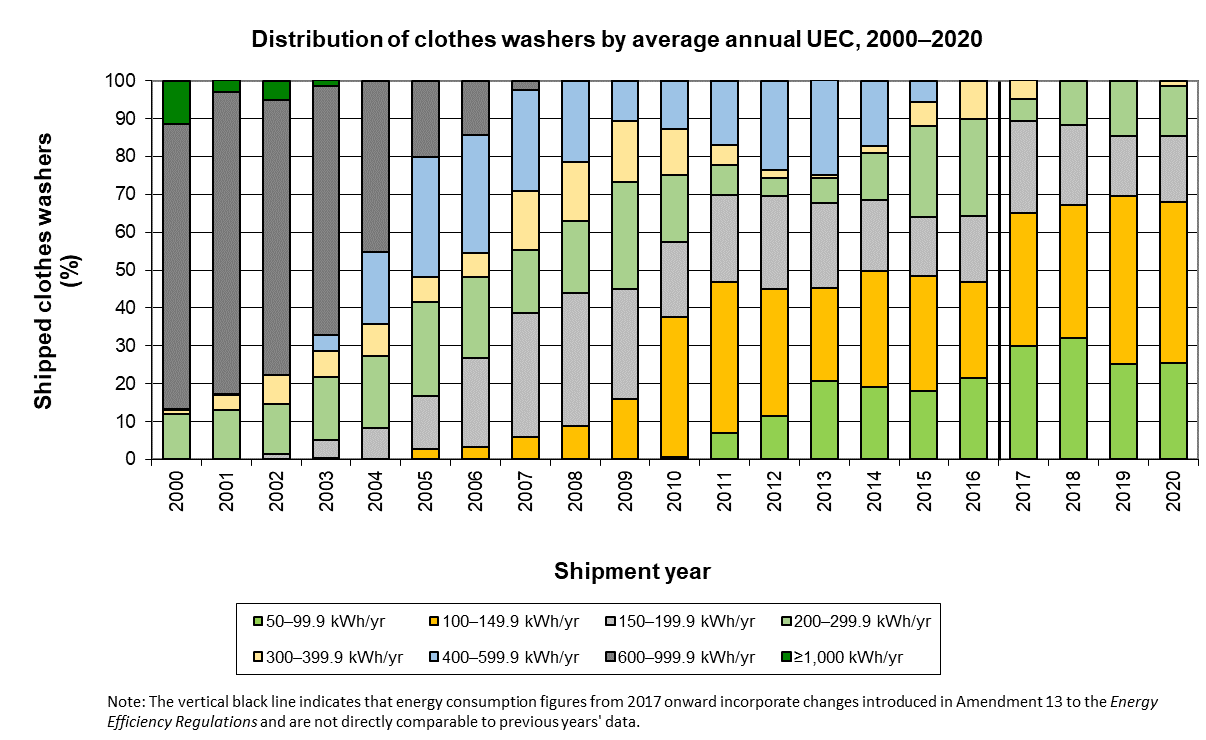
Distribution of shipments by unit energy consumption
In 2000, 87% of all clothes washers consumed at least 600 kWh/yr. By 2020, 85.3% of electric clothes washers consumed less than 200 kWh/yr. As previously noted, this decrease in energy consumption is due to changes to the test procedures used to measure energy efficiency, which were updated as a result of amendments to the Energy Efficiency Regulations that came into force in 2017. The data for 2017 onward are not directly comparable to previous years’ data.
Text version
Distribution of clothes washers by average annual UEC, 2000–2020 (%)
| Shipment year | Average Annual Unit Energy Consumption (UEC) (kWh/year) | |||||||
|---|---|---|---|---|---|---|---|---|
| 50–99.9 | 100–149.9 | 150–199.9 | 200–299.9 | 300–399.9 | 400–599.9 | 600–999.9 | ≥1,000 | |
| 2000 | 0.0 | 0.0 | 0.0 | 12.0 | 1.0 | 0.3 | 75.3 | 11.4 |
| 2001 | 0.0 | 0.0 | 0.0 | 13.0 | 4.1 | 0.1 | 79.9 | 3.0 |
| 2002 | 0.0 | 0.1 | 1.2 | 13.3 | 7.7 | 0.0 | 72.7 | 5.0 |
| 2003 | 0.0 | 0.3 | 4.7 | 16.8 | 6.8 | 4.3 | 65.6 | 1.6 |
| 2004 | 0.0 | 0.2 | 8.1 | 18.9 | 8.5 | 19.1 | 45.2 | 0.0 |
| 2005 | 0.0 | 2.8 | 14.0 | 24.6 | 6.8 | 31.7 | 20.1 | 0.0 |
| 2006 | 0.0 | 3.3 | 23.5 | 21.3 | 6.4 | 31.2 | 14.2 | 0.0 |
| 2007 | 0.0 | 5.9 | 32.6 | 16.8 | 15.6 | 26.6 | 2.5 | 0.0 |
| 2008 | 0.0 | 8.7 | 35.3 | 19.0 | 15.4 | 21.5 | 0.0 | 0.0 |
| 2009 | 0.0 | 15.9 | 29.1 | 28.2 | 16.2 | 10.5 | 0.2 | 0.0 |
| 2010 | 0.6 | 36.9 | 20.0 | 17.6 | 12.1 | 12.6 | 0.2 | 0.0 |
| 2011 | 7.0 | 39.8 | 23.2 | 7.7 | 5.3 | 16.9 | 0.2 | 0.0 |
| 2012 | 11.5 | 33.4 | 24.7 | 4.6 | 2.1 | 23.7 | 0.0 | 0.0 |
| 2013 | 20.8 | 24.5 | 22.3 | 6.6 | 0.7 | 25.1 | 0.0 | 0.0 |
| 2014 | 19.2 | 30.5 | 18.9 | 12.3 | 1.9 | 17.2 | 0.0 | 0.0 |
| 2015 | 18.0 | 30.3 | 15.7 | 23.9 | 6.5 | 5.6 | 0.0 | 0.0 |
| 2016 | 21.4 | 25.4 | 17.3 | 25.7 | 10.1 | 0.1 | 0.0 | 0.0 |
| 2017 Footnote 1 | 30.0 | 35.2 | 24.3 | 5.8 | 4.8 | 0.0 | 0.0 | 0.0 |
| 2018 | 32.1 | 35.1 | 21.1 | 11.7 | 0.0 | 0.0 | 0.0 | 0.0 |
| 2019 | 25.2 | 44.4 | 15.8 | 14.6 | 0.0 | 0.0 | 0.0 | 0.0 |
| 2020 | 25.5 | 42.3 | 17.4 | 13.3 | 1.4 | 0.0 | 0.0 | 0.0 |