Energy Consumption of Freezers

Key facts
- The market share of upright freezers decreased to 36.5% in 2020, compared to 46% in 2019. Footnote 1 When compared to other freezers, their average annual unit energy consumption (UEC) improved the most during the period 2000-2020. Footnote 2
- Since 2010, compact chest freezers have had the largest share of shipped freezers (almost 42% in 2020). Compared with full-size chest and upright freezers, compact chest freezers consumed the least amount of energy overall because of their small size. Footnote 3
To learn more about purchasing an energy-efficient freezer, please visit
Average annual unit energy consumption (UEC)
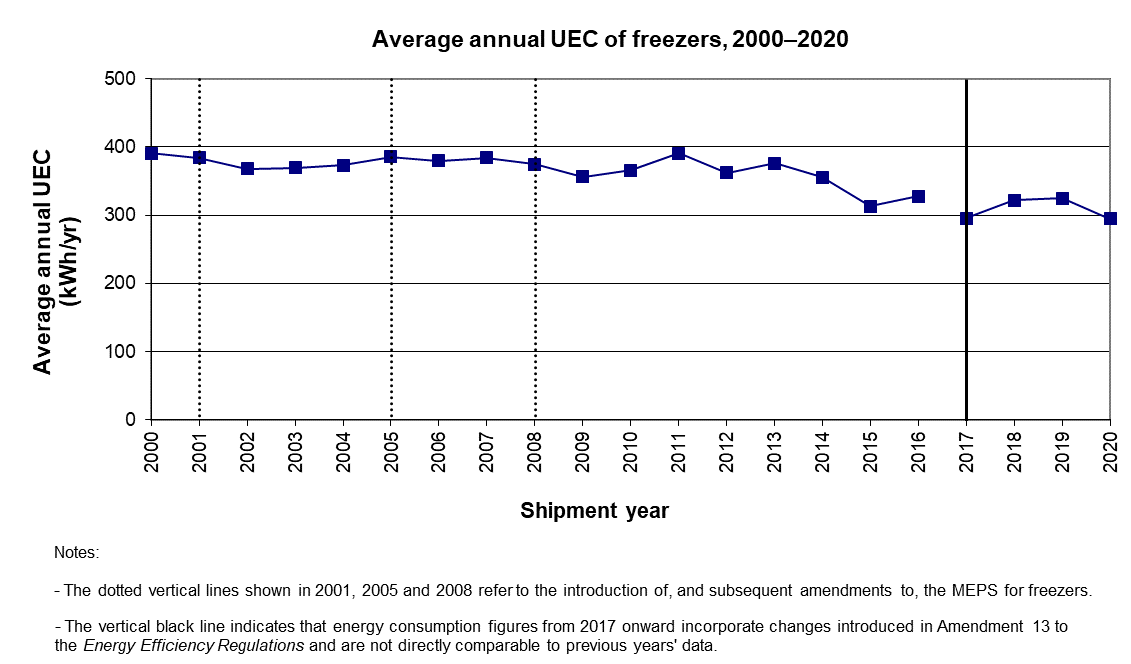
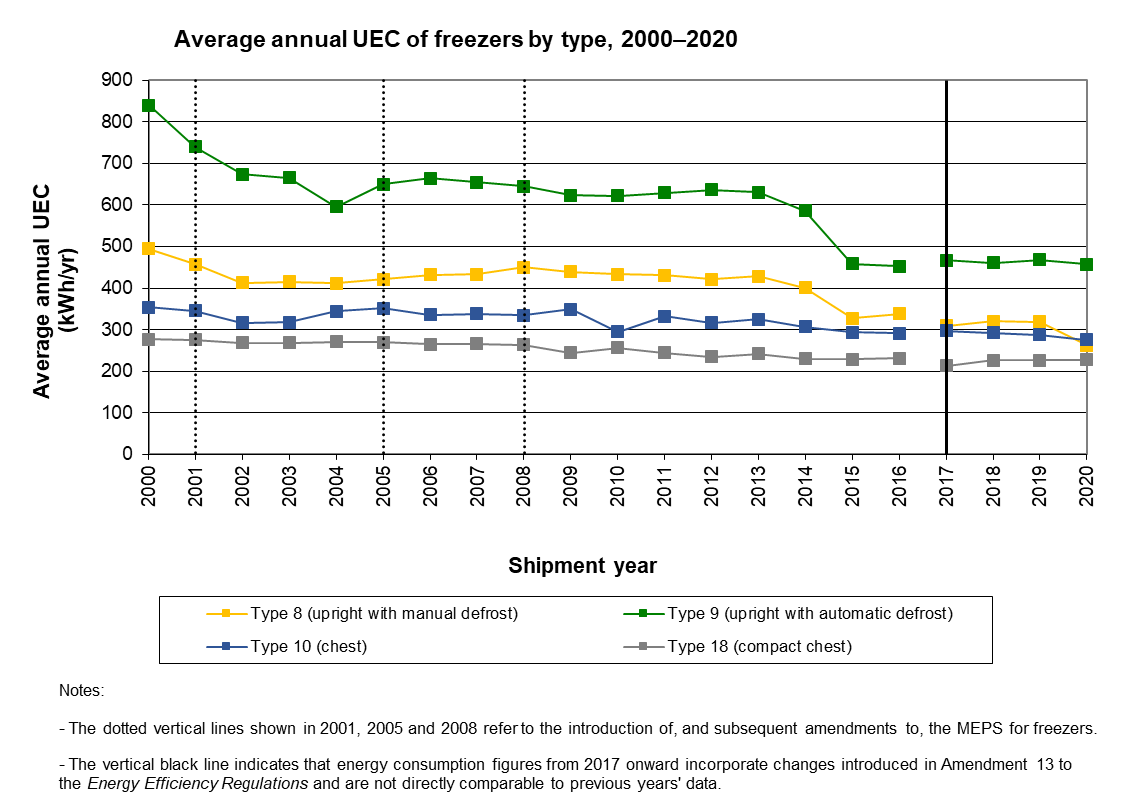
Over the past 21 years, the average annual UEC by type of freezer has fluctuated between 213 and 840 kWh/yr, depending on consumer preference for a type of freezer (chest, upright, compact). The average annual UEC of total freezers Footnote 4 ranged from 391 to 295 kWh/yr. Footnote 5
Text version
Average annual UEC of freezers, 2000–2020 (kWh/yr)
| Shipment year | Average Annual Unit Energy Consumption (UEC) (kWh/yr) |
|---|---|
| 2000 | 390.9 |
| 2001 Footnote 1 | 383.9 |
| 2002 | 367.7 |
| 2003 | 369.1 |
| 2004 | 372.7 |
| 2005 Footnote 2 | 385.6 |
| 2006 | 379.6 |
| 2007 | 384.0 |
| 2008 Footnote 2 | 374.8 |
| 2009 | 356.3 |
| 2010 | 365.5 |
| 2011 | 390.3 |
| 2012 | 362.3 |
| 2013 | 376.2 |
| 2014 | 355.5 |
| 2015 | 313.2 |
| 2016 | 327.7 |
| 2017 Footnote 3 | 295.3 |
| 2018 | 321.6 |
| 2019 | 324.5 |
| 2020 | 294.6 |
Freezer types
The type of freezer affects how much energy it consumes.
- Upright freezers with automatic defrost (Type 9) and upright freezers with manual defrost (Type 8) generally have a high UEC because they lose more cold air than chest freezers. Upright freezers lose more cold air than a chest freezer because the refrigerated air in an upright freezer flows down and out of the freezer when the door is opened. However, following the introduction of, and subsequent amendments to, the MEPS in the Energy Efficiency Regulations, the average annual UEC of upright freezers improved the most from 2000 to 2020 Footnote 6 , both in absolute and relative terms. Upright freezers accounted for a growing segment of the freezer market.
- Chest freezers (Type 10 and 18) are generally more energy-efficient because only a small amount of cold air flows out when the lid is opened.
Text version
Average annual UEC of freezers by type, 2000–2020 (kWh/yr)
| Shipment year | Type 8 (upright with manual defrost) | Type 9 (upright with automatic defrost) | Type 10 (chest) | Type 18 (compact chest) |
|---|---|---|---|---|
| 2000 | 494.8 | 839.4 | 354.0 | 277.1 |
| 2001 Footnote 1 | 456.9 | 740.5 | 345.1 | 275.7 |
| 2002 | 412.7 | 674.2 | 316.7 | 267.7 |
| 2003 | 414.8 | 665.4 | 317.8 | 268.3 |
| 2004 | 412.0 | 595.9 | 344.1 | 271.1 |
| 2005 Footnote 2 | 420.8 | 650.1 | 351.8 | 269.1 |
| 2006 | 431.8 | 664.2 | 335.8 | 265.0 |
| 2007 | 432.9 | 654.1 | 337.6 | 265.7 |
| 2008 Footnote 2 | 449.8 | 644.5 | 334.1 | 263.3 |
| 2009 | 438.9 | 622.7 | 348.4 | 243.7 |
| 2010 | 432.8 | 621.7 | 294.6 | 256.6 |
| 2011 | 431.2 | 629.5 | 331.6 | 244.1 |
| 2012 | 420.6 | 636.2 | 316.6 | 234.7 |
| 2013 | 428.3 | 630.3 | 325.3 | 241.9 |
| 2014 | 400.3 | 586.2 | 306.3 | 229.3 |
| 2015 | 326.8 | 458.3 | 293.0 | 229.1 |
| 2016 | 337.5 | 452.5 | 291.2 | 231.4 |
| 2017 Footnote 3 | 309.6 | 466.5 | 297.5 | 212.6 |
| 2018 | 319.8 | 461.0 | 292.7 | 226.5 |
| 2019 | 318.6 | 467.4 | 287.6 | 226.4 |
| 2020 | 262.3 | 457.4 | 275.0 | 227.2 |
Annual energy consumption per volume
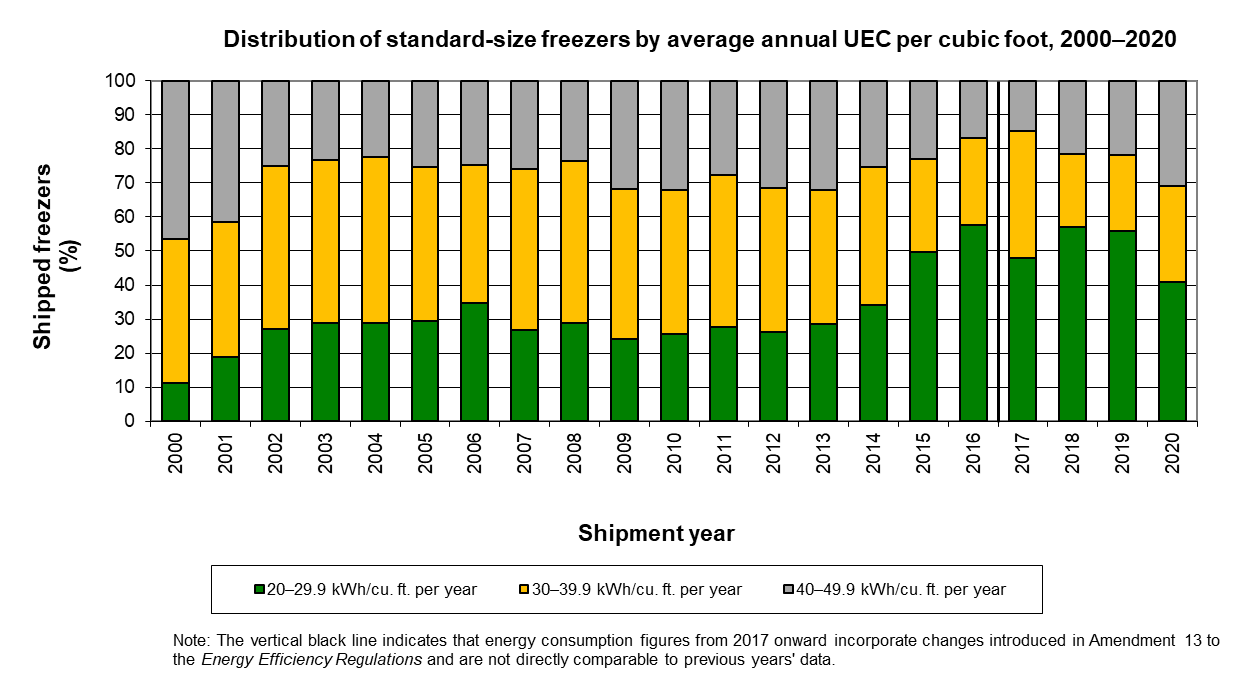
The average annual energy consumption per volume of standard-size freezers fluctuated over the years. More large sized freezers (40-49.9 kWh/cu. ft.) were shipped in 2020 compared to the previous year.
Text version
Distribution of standard-size freezers by average annual UEC per cubic foot, 2000–2020 (%)
| Shipment year | Average Annual Unit Energy Consumption (UEC) (kWh/cu. ft. per year) | ||
|---|---|---|---|
| 20–29.9 | 30–39.9 | 40–49.9 | |
| 2000 | 11.2 | 42.3 | 46.5 |
| 2001 | 19.0 | 39.5 | 41.5 |
| 2002 | 27.0 | 47.9 | 25.1 |
| 2003 | 28.8 | 47.8 | 23.4 |
| 2004 | 28.9 | 48.8 | 22.3 |
| 2005 | 29.5 | 45.2 | 25.3 |
| 2006 | 34.8 | 40.4 | 24.7 |
| 2007 | 26.7 | 47.5 | 25.9 |
| 2008 | 28.9 | 47.5 | 23.6 |
| 2009 | 24.2 | 43.9 | 31.9 |
| 2010 | 25.5 | 42.5 | 32.0 |
| 2011 | 27.6 | 44.8 | 27.6 |
| 2012 | 26.1 | 42.4 | 31.5 |
| 2013 | 28.5 | 39.3 | 32.2 |
| 2014 | 34.3 | 40.2 | 25.5 |
| 2015 | 49.8 | 27.3 | 23.0 |
| 2016 | 57.6 | 25.6 | 16.8 |
| 2017 Footnote 1 | 48.0 | 37.1 | 14.9 |
| 2018 | 57.0 | 21.4 | 21.6 |
| 2019 | 55.9 | 22.3 | 21.8 |
| 2020 | 40.8 | 28.3 | 30.9 |