Energy Consumption of Electric Ranges

Key facts
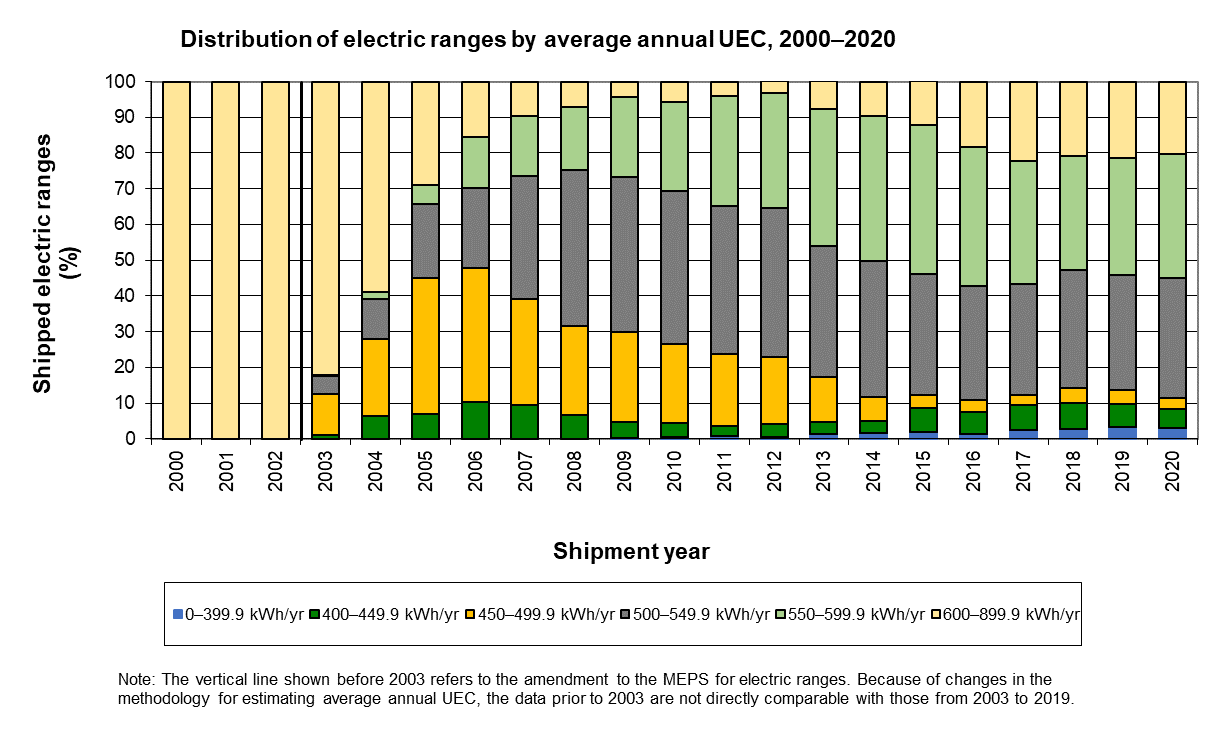
- Ranges with larger UECs lost significant market shares during the period of 2003-2009. For example, the market share of electric ranges with average annual UEC of 600 kWh/yr – 899 kWh/yr decreased from 82.1% in 2013 to 4.3% in 2009.
- The share of this category regained some market shares between 2009 and 2020, increasing from 4.3% in 2009 to 20.3% in 2020.
Average annual unit energy consumption (UEC)
- All residential electric ranges Footnote 1 are subject to . These regulated products must meet federal energy efficiency standards to be sold or imported to the Canadian market, which helps eliminate the least energy-efficient products from the Canadian market.
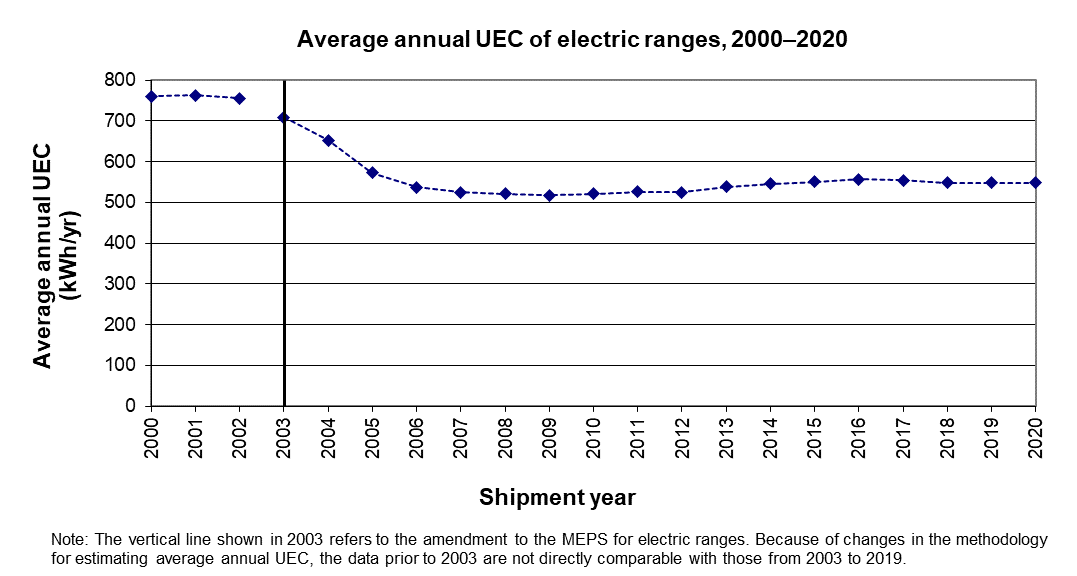
- Between 2003 and 2009, the average annual unit energy consumption (UEC) for electric ranges decreased 27%.
- The average annual UEC for electric ranges has remained relatively unchanged since 2009, with a slight increase over the last 10 years.
The decrease in UEC after 2002 is not due entirely to an improvement in energy efficiency. In 2003, changes to the MEPS reduced the frequency of the self-cleaning cycle. These changes affected the overall average annual UEC of self-cleaning ranges, which means that data prior to 2003 are not directly comparable with data after that date.
Text version
Average annual (UEC) of electric ranges, 2000–2020 (kWh/yr)
| Shipment year | Average Annual Unit Energy Consumption (UEC) (kWh/yr) |
|---|---|
| 2000 | 759.9 |
| 2001 | 762.5 |
| 2002 | 756.0 |
| 2003 Footnote 1 | 709.4 |
| 2004 | 652.7 |
| 2005 | 572.5 |
| 2006 | 537.2 |
| 2007 | 524.3 |
| 2008 | 521.7 |
| 2009 | 517.7 |
| 2010 | 521.7 |
| 2011 | 525.7 |
| 2012 | 523.3 |
| 2013 | 538.7 |
| 2014 | 546.0 |
| 2015 | 550.5 |
| 2016 | 556.4 |
| 2017 | 554.1 |
| 2018 | 548.7 |
| 2019 | 548.2 |
| 2020 | 548.7 |
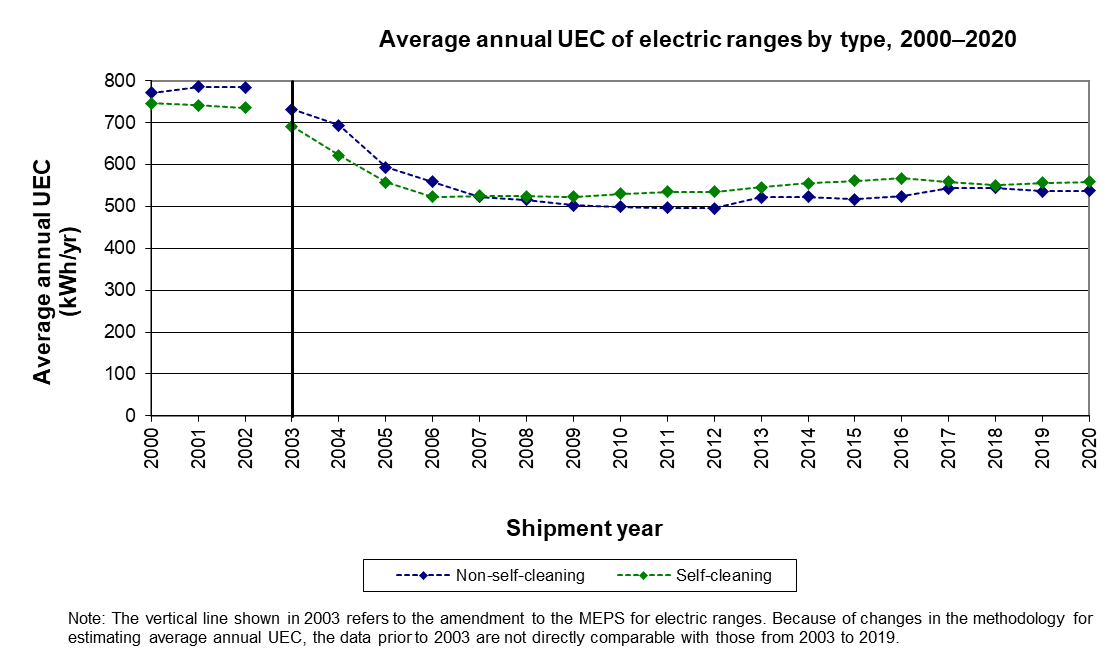
Self-cleaning versus non-self-cleaning ranges
Self-cleaning ranges have typically been more energy-efficient than non-self-cleaning ranges because they usually have better insulation. However, newer self-cleaning ranges tend to have more energy consuming options such as:
- baking drawers;
- true temperature systems to manage temperature;
- larger heating elements;
- bridge elements;
- warming zones.
Non-self-cleaning ranges have become increasingly more efficient. Since 2007, they have typically consumed less energy than self-cleaning ranges.
Text version
Average annual UEC of electric ranges by type, 2000–2020 (kWh/yr)
| Shipment year | Non-self-cleaning | Self-cleaning |
|---|---|---|
| 2000 | 770.7 | 746.3 |
| 2001 | 785.7 | 741.2 |
| 2002 | 783.9 | 735.2 |
| 2003 Footnote 1 | 732.1 | 691.0 |
| 2004 | 694.1 | 622.4 |
| 2005 | 593.2 | 558.0 |
| 2006 | 558.9 | 522.7 |
| 2007 | 522.4 | 525.2 |
| 2008 | 516.3 | 524.1 |
| 2009 | 502.6 | 523.5 |
| 2010 | 499.3 | 529.7 |
| 2011 | 496.6 | 534.4 |
| 2012 | 495.5 | 535.0 |
| 2013 | 522.1 | 545.8 |
| 2014 | 523.0 | 555.0 |
| 2015 | 516.8 | 561.0 |
| 2016 | 524.0 | 567.6 |
| 2017 | 543.2 | 559.3 |
| 2018 | 544.3 | 550.6 |
| 2019 | 535.9 | 555.7 |
| 2020 | 537.3 | 559.3 |
Distribution of shipped ranges by unit energy consumption
In 2003, 82% of shipped electric ranges consumed 600 kWh/yr or more.
By 2020, 45% of shipped ranges consumed fewer than 550 kWh/yr (some of this decrease is due to changes to the method for calculating UEC ratings in 2003).
Text version
Distribution of electric ranges by average annual UEC, 2000–2020 (%)
| Shipment year | Average Annual Unit Energy Consumption (UEC) (kWh/yr) | |||||
|---|---|---|---|---|---|---|
| 0–399.9 | 400–449.9 | 450–499.9 | 500–549.9 | 550–599.9 | 600–899.9 | |
| 2000 | 0.0 | 0.0 | 0.0 | 0.0 | 0.0 | 100.0 |
| 2001 | 0.0 | 0.0 | 0.0 | 0.0 | 0.0 | 100.0 |
| 2002 | 0.0 | 0.0 | 0.0 | 0.0 | 0.0 | 100.0 |
| 2003 Footnote 1 | 0.0 | 0.9 | 11.6 | 4.9 | 0.5 | 82.1 |
| 2004 | 0.0 | 6.3 | 21.5 | 11.4 | 1.9 | 58.9 |
| 2005 | 0.0 | 7.0 | 37.9 | 20.8 | 5.4 | 28.9 |
| 2006 | 0.0 | 10.4 | 37.5 | 22.4 | 14.2 | 15.5 |
| 2007 | 0.0 | 9.3 | 29.7 | 34.6 | 16.6 | 9.8 |
| 2008 | 0.0 | 6.7 | 25.0 | 43.4 | 17.8 | 7.1 |
| 2009 | 0.1 | 4.5 | 25.2 | 43.4 | 22.5 | 4.3 |
| 2010 | 0.6 | 3.7 | 22.1 | 43.0 | 25.0 | 5.6 |
| 2011 | 0.8 | 2.8 | 19.9 | 41.7 | 30.5 | 4.2 |
| 2012 | 0.6 | 3.5 | 18.7 | 41.8 | 32.1 | 3.5 |
| 2013 | 1.4 | 3.3 | 12.5 | 36.7 | 38.4 | 7.8 |
| 2014 | 1.5 | 3.4 | 6.8 | 38.0 | 40.8 | 9.5 |
| 2015 | 1.8 | 6.9 | 3.5 | 34.0 | 41.5 | 12.3 |
| 2016 | 1.2 | 6.3 | 3.4 | 31.8 | 39.0 | 18.3 |
| 2017 | 2.5 | 7.0 | 2.8 | 30.9 | 34.6 | 22.2 |
| 2018 | 2.9 | 7.0 | 4.2 | 33.2 | 31.9 | 20.7 |
| 2019 | 3.2 | 6.5 | 3.9 | 32.2 | 32.8 | 21.4 |
| 2020 | 3.1 | 5.2 | 3.2 | 33.6 | 34.6 | 20.3 |