
Natural Resources Canada
www.nrcan.gc.ca
Common menu bar links
Office of Energy Efficiency Links
Office of Energy Efficiency
Menu
Energy Consumption of Major Household Appliances Shipped in Canada – Trends for 1990–2005
1 REFRIGERATORS
Refrigerators are available in various sizes and with a variety of features, all of which affect energy consumption. Consequently, EnerGuide groups refrigerators according to type and size, thereby enabling you to compare the energy consumption of similar models. Table 1.1 compares the market share of the various types of refrigerators in 2005.
The following are the definitions of the various types of refrigerators:
Refrigerators without automatic defrost
Type 1 Refrigerators and refrigerator-freezers with manual defrost
Type 2 Refrigerator-freezers with partial automatic defrost
Refrigerators with automatic defrost
Type 3 Refrigerator-freezers with automatic defrost and top-mounted freezer, but without through-the-door ice service; also all-refrigerators22 with automatic defrost
Type 4 Refrigerator-freezers with automatic defrost and side-mounted freezer, but without through-the-door ice service
Type 5 Refrigerator-freezers with automatic defrost and bottom-mounted freezer, but without through-the-door ice service
Type 6 Refrigerator-freezers with automatic defrost, top-mounted freezer and through-the-door ice service
Type 7 Refrigerator-freezers with automatic defrost, side-mounted freezer and through-the-door ice service
Refrigerators – compact
Type 11 Compact refrigerators and refrigerator-freezers with manual defrost
Type 12 Compact refrigerators and refrigerator-freezers with partial automatic defrost
Type 13 Compact refrigerator-freezers with automatic defrost and top-mounted freezer; also compact all-refrigerators with automatic defrost
Type 14 Compact refrigerator-freezers with automatic defrost and side-mounted freezer
Type 15 Compact refrigerator-freezers with automatic defrost and bottom-mounted freezer
TABLE 1.1
Refrigerator Market, 2005
| Type of Refrigerator | Market Share (%) |
|---|---|
| 1 | 0.0 |
| 2 | 0.0 |
| 3 | 64.8 |
| 4 | 1.1 |
| 5 | 17.9 |
| 6 | 0.0 |
| 7 | 9.6 |
| 11 | 6.3 |
| 12 | 0.0 |
| 13 | 0.1 |
| 14 | 0.0 |
| 15 | 0.0 |
| 100.0 | |
| Through-the-Door Ice Service | 9.6 |
| Type of Freezer* | |
| Top-mounted | 64.9 |
| Side-mounted | 11.3 |
| Bottom-mounted | 17.9 |
| Without freezer | 5.8 |
| 100.0 | |
Due to rounding, the numbers may not add up to 100.
1.1 2005 Market Snapshot
The shipment-weighted average annual unit energy consumption (UEC) of all refrigerators shipped in 2005 was 469 kilowatt hours (kWh). In 2005, as in all years studied since 1990, Type 3 refrigerators (those with a top-mounted freezer and automatic defrost) were the most popular type in Canada, accounting for 64.8 percent of all refrigerators shipped on the Canadian market. The shipment-weighted average annual UEC of Type 3, and all other refrigerator types, is outlined in Table D.1 in Appendix D, "Detailed Tables." The most popular size category, 16.5 to 18.4 cubic feet (cu. ft.), accounted for 41.6 percent of the market in 2005.
In 2005, 37.6 percent of the refrigerator models on the market qualified as ENERGY STAR® products, exceeding the minimum energy performance standards (MEPS) by at least 15 percent (refer to Table D.A.1 in Appendix D, "Detailed Tables").
- In 2005, refrigerators with a volume between 16.5 and 18.4 cu. ft. remained the most popular, on average accounting for 41.6 percent of the market.
- From 1990 to 2005, the largest refrigerators (those with a volume of at least 20.5 cu. ft.) more than quadrupled in market share – rising from 5.1 to 21.7 percent.
- In 1990, refrigerators larger than 16.4 cu. ft. consumed on average more than 1000 kWh of electricity per year. By 2005, refrigerators that size consumed less than half as much energy, and some of the largest units (28.5 to 30.4 cu. ft.) consumed, on average, only 628 kWh of electricity per year.
1.2 Distribution of Shipments
1.2.1 Distribution by Type
TABLE 1.2
Distribution of Refrigerators by Type
| Model Year |
Type 1 |
Type 2 |
Type 3 |
Type 4 |
Type 5 |
Type 6 |
Type 7 |
Type 11 |
Type 13 |
|---|---|---|---|---|---|---|---|---|---|
| (%) | (%) | (%) | (%) | (%) | (%) | (%) | (%) | (%) | |
| 1990 | 3.5 | 2.0 | 84.9 | 7.6 | 0.6 | 0.0 | 0.0 | 0.1 | 1.2 |
| 1991 | 3.1 | 0.3 | 84.3 | 9.0 | 0.8 | 0.0 | 0.3 | 0.3 | 2.0 |
| 1992 | 2.1 | 0.4 | 85.4 | 7.5 | 0.3 | 0.0 | 3.5 | 0.1 | 0.6 |
| 1993 | 1.1 | 0.6 | 85.5 | 6.8 | 0.7 | 0.0 | 4.2 | 0.1 | 0.9 |
| 1994 | 0.6 | 0.7 | 85.1 | 4.9 | 2.0 | 0.1 | 4.3 | 1.3 | 1.0 |
| 1995 | 0.2 | 0.6 | 84.8 | 4.6 | 1.6 | 0.1 | 5.2 | 1.9 | 1.0 |
| 1996 | 0.2 | 0.5 | 84.8 | 4.4 | 2.2 | 0.1 | 6.6 | 0.8 | 0.4 |
| 1997 | 0.4 | 0.1 | 83.8 | 3.8 | 3.2 | 0.0 | 8.3 | 0.4 | 0.0 |
| 1998 | 0.4 | 0.0 | 76.5 | 3.3 | 8.5 | 0.3 | 7.3 | 3.6 | 0.0 |
| 1999 | 0.1 | 0.0 | 76.6 | 2.4 | 8.4 | 0.4 | 7.5 | 4.6 | 0.0 |
| 2000 | 0.0 | 0.0 | 72.9 | 2.2 | 11.1 | 0.5 | 7.9 | 5.3 | 0.0 |
| 2001 | 0.0 | 0.0 | 71.1 | 2.1 | 11.1 | 0.4 | 9.1 | 6.1 | 0.1 |
| 2002 | 0.0 | 0.0 | 70.2 | 2.2 | 10.6 | 0.2 | 11.0 | 5.8 | 0.1 |
| 2003 | 0.0 | 0.0 | 68.2 | 2.4 | 13.9 | 0.1 | 11.2 | 2.0 | 2.2 |
| 2004 | 0.0 | 0.0 | 66.4 | 1.9 | 15.5 | 0.1 | 11.0 | 4.5 | 0.5 |
| 2005 | 0.0 | 0.0 | 64.8 | 1.1 | 17.9 | 0.0 | 9.6 | 6.3 | 0.1 |
| Total Change |
-3.5% | -2.0% | -20.1% | -6.5% | +17.3% | 0.0% | +9.6% | +6.2% | -1.1% |
Although Type 3 refrigerators were consistently the most shipped model between 1990 and 2005, their market share declined from 84.9 to 64.8 percent of all refrigerators shipped, as demonstrated in Table 1.2 and Figure 1.1.
There seems to be an increasing trend toward refrigerators with a bottom-mounted freezer (Type 5). These refrigerators did not have a significant market share in 1990; but with a steady increase in popularity, they accounted for 17.9 percent of the market in 2005. Also, refrigerators with a side-mounted freezer, automatic defrost and through-the-door ice service (Type 7) remained popular, accounting for 9.6 percent of the market in 2005. Out of these two increasingly popular refrigerator types (5 and 7), Type 5 is generally more energy efficient (see Figure 1.2 and Table D.1 in Appendix D, "Detailed Tables"). Types 1, 2, 4, 6 and 13 had almost disappeared from the market by 2005. Data on Types 12, 14 and 15 refrigerators are available, but because the values are so low, they were not included in the analysis.

Click here to view larger image
Figure 1.2 demonstrates the average annual UEC of the four most popular refrigerator types during the study period. Type 11 and Type 3 refrigerators remained the most energy efficient, followed by Types 5 and 7.

1.2.2 Distribution by Type, by Region/Province
As previously mentioned, Type 3 refrigerators (those with a top-mounted freezer and automatic defrost) remained the most shipped model in 2005, with a national average of 64.8 percent. Figure 1.3 illustrates the distribution of the various types of refrigerators throughout the regions/provinces, in 2004 and 2005.

Click here to view larger image
* For more information, see Table D.2 in Appendix D, "Detailed Tables."
Type 3 refrigerators remained the most popular in the Atlantic provinces, whereas Type 5 (those with a bottom-mounted freezer and automatic defrost) remained more popular in Quebec (19 percent in 2004 and 21 percent in 2005), followed by Ontario and the Western provinces (13 to 14 percent in 2004 and 16 to 18 percent in 2005). Type 7 (those with a side-mounted freezer, automatic defrost and through-the-door ice service) were more popular in Ontario and the Western provinces (13 to 14 percent in 2004 and 11 to 12 percent in 2005). The popularity of Type 11 refrigerators (compact refrigerators with manual defrost) grew in British Columbia and the Territories (from 11 percent in 2004 to 16 percent in 2005).
1.2.3 Distribution by Channel, by Region/Province
Figure 1.4 demonstrates the proportion of refrigerators shipped for retail sales23 versus those shipped for builder sales,24 for 2004 and 2005. It shows slight decreases in builder shipments for all regions of the country. Once again, British Columbia and the Territories had a substantially larger builder representation than the other regions; shipments of refrigerators to builders in Quebec were again relatively low.

Click here to view larger image
* For more information, see Table D.3 in Appendix D, "Detailed Tables."
1.2.4 Distribution by Volume
TABLE 1.3
Distribution of Refrigerators by Volume
| Model Year |
Volume (cu. ft.) | ||||||
|---|---|---|---|---|---|---|---|
| <10.5 | 10.5–12.4 | 12.5–14.4 | 14.5–16.4 | 16.5–18.4 | 18.5–20.4 | >20.5 | |
| (%) | (%) | (%) | (%) | (%) | (%) | (%) | |
| 1990 | 3.8 | 13.2 | 17.8 | 14.1 | 43.3 | 2.6 | 5.1 |
| 1991 | 2.6 | 14.2 | 11.0 | 14.2 | 47.9 | 5.4 | 4.7 |
| 1992 | 1.6 | 10.9 | 10.0 | 19.6 | 42.0 | 8.3 | 7.6 |
| 1993 | 2.2 | 8.0 | 7.1 | 16.6 | 45.3 | 12.2 | 8.7 |
| 1994 | 3.4 | 9.5 | 6.9 | 16.5 | 45.8 | 8.7 | 9.3 |
| 1995 | 3.7 | 14.1 | 6.7 | 15.0 | 39.5 | 10.8 | 10.2 |
| 1996 | 1.9 | 13.5 | 6.7 | 13.4 | 38.6 | 12.5 | 13.4 |
| 1997 | 0.9 | 11.1 | 6.9 | 12.2 | 39.2 | 12.7 | 16.9 |
| 1998 | 4.0 | 9.3 | 7.1 | 10.6 | 42.7 | 11.1 | 15.2 |
| 1999 | 5.3 | 7.6 | 6.9 | 9.9 | 43.5 | 10.0 | 16.8 |
| 2000 | 6.5 | 6.6 | 7.7 | 9.0 | 41.2 | 9.3 | 19.7 |
| 2001 | 8.1 | 5.6 | 6.7 | 8.7 | 36.4 | 11.4 | 23.2 |
| 2002 | 6.3 | 5.5 | 7.4 | 6.8 | 34.6 | 15.3 | 24.2 |
| 2003 | 4.9 | 3.9 | 6.1 | 8.6 | 37.0 | 15.7 | 23.9 |
| 2004 | 5.6 | 3.0 | 3.3 | 11.0 | 39.2 | 14.3 | 23.5 |
| 2005 | 7.0 | 2.5 | 2.3 | 9.7 | 41.6 | 15.2 | 21.7 |
| Total Change |
+3.5% | -10.7% | -15.5% | -4.4% | -1.7% | +12.6% | +16.6% |
Refrigerators with a volume between 16.5 and 18.4 cu. ft. remained the most popular, on average accounting for 41.6 percent of the market in 2005, as outlined in Table 1.3 and Figure 1.5. However, a trend toward larger refrigerators had emerged. The market share of refrigerators with a capacity greater than 16.5 cu. ft. increased steadily during the study period – rising from 51.0 percent to 78.6 percent. This increase is also evidenced in the findings of the 2003 Survey of Household Energy Use25 where, in 2003, more than 61 percent of households possessed a main refrigerator larger than 16.5 cu. ft.

Click here to view larger image
1.2.5 Distribution by Volume, by Region/Province
Figure 1.6 demonstrates that refrigerators between 16.5 and 18.4 cu. ft. were the most popular nationally in 2004 and 2005. This chart shows that consumers in the Atlantic provinces purchased slightly larger refrigerators in 2005, where demand for refrigerators between 16.5 and 18.4 cu. ft. grew from 40.3 percent in 2004 to 47.1 percent in 2005. This chart also shows that British Columbia and the Territories received more shipments of small refrigerators (those smaller than 10.5 cu. ft.) in 2005 (17.3 percent in 2005 compared with 12.7 percent in 2004).

Click here to view larger image
* For more information, see Table D.4 in Appendix D, "Detailed Tables."
Figure 1.7 compares the national breakdown of the distribution of refrigerators for retail sales and builder sales in 2004 and 2005. Although the most popular size of refrigerator in both cases for both years was between 16.5 and 18.4 cu. ft., retail shipments of refrigerators larger than 18.5 cu. ft. remained higher in 2005 than those shipped for the builder trade. This chart also shows that shipments of refrigerators between 14.5 and 16.4 cu. ft. to builders remained higher in 2005 than those shipped for retail sales.
The channel (retail versus builder) data also show that retail shipments of refrigerators smaller than 10.5 cu. ft. remained quite high in British Columbia and the Territories. Similarly, retail shipments of those between 14.5 and 16.4 cu. ft. remained higher in the Atlantic provinces. Builder shipments of refrigerators between 10.5 and 12.4 cu. ft. remained higher in the Atlantic provinces and Quebec. Similarly, builder shipments of the largest refrigerators (those larger than 20.5 cu. ft.) remained highest in the Prairies and in British Columbia and the Territories. For more information, see Tables D.5 and D.6 in Appendix D, "Detailed Tables."

* For more information, see Table D.5 and D.6 in Appendix D, "Detailed Tables."
1.2.6 Distribution by Average Annual Unit Energy Consumption per Cubic Foot
Refrigerators are becoming more efficient, thanks largely to the ongoing efforts of manufacturers, the MEPS and the amendment to the MEPS. Note in Table 1.4 and Figure 1.8 that, since this 2001 amendment to the MEPS, there has been a substantial improvement in the energy efficiency of refrigerators.26 By 2005, 86.7 percent of refrigerators consumed less than 30 kWh per cu. ft. per year, even though there was a definite trend toward larger ones, as illustrated in Table 1.3.
Also responsible for the trend toward the purchase of more energy-efficient refrigerators are the various initiatives and incentives offered by the federal, provincial and municipal governments and utilities.
TABLE 1.4
Distribution of Refrigerators by Average Annual Unit Energy Consumption per Cubic Foot
| Model Year |
kWh/cu. ft. per year | |||||||
|---|---|---|---|---|---|---|---|---|
| <30 | 30–39.9 | 40–49.9 | 50–59.9 | 60–69.9 | 70–79.9 | 80–89.9 | >90 | |
| (%) | (%) | (%) | (%) | (%) | (%) | (%) | (%) | |
| 1990 | 0.0 | 1.5 | 3.9 | 15.3 | 60.2 | 15.4 | 3.0 | 0.7 |
| 1991 | 0.0 | 2.9 | 10.7 | 26.9 | 41.3 | 12.2 | 3.6 | 2.4 |
| 1992 | 0.0 | 4.8 | 26.9 | 33.2 | 16.0 | 10.4 | 4.0 | 4.8 |
| 1993 | 0.1 | 51.0 | 29.7 | 9.1 | 1.4 | 4.2 | 1.9 | 2.6 |
| 1994 | 0.4 | 70.9 | 22.4 | 4.0 | 0.0 | 0.0 | 1.7 | 0.6 |
| 1995 | 2.8 | 63.3 | 29.3 | 1.6 | 0.0 | 0.1 | 2.5 | 0.5 |
| 1996 | 6.6 | 60.0 | 31.2 | 0.9 | 0.1 | 0.0 | 0.7 | 0.4 |
| 1997 | 6.9 | 60.4 | 31.4 | 0.9 | 0.1 | 0.0 | 0.2 | 0.1 |
| 1998 | 5.9 | 62.4 | 27.1 | 0.8 | 0.0 | 0.6 | 2.9 | 0.2 |
| 1999 | 8.4 | 61.2 | 25.0 | 0.6 | 0.2 | 0.7 | 3.4 | 0.6 |
| 2000 | 12.2 | 57.4 | 23.6 | 0.9 | 0.4 | 0.7 | 3.6 | 1.2 |
| 2001 | 44.5 | 34.5 | 12.7 | 1.3 | 0.8 | 4.0 | 0.7 | 1.5 |
| 2002 | 64.3 | 26.6 | 3.1 | 0.2 | 0.0 | 3.9 | 0.2 | 1.7 |
| 2003 | 78.4 | 15.5 | 1.6 | 0.2 | 0.2 | 2.8 | 0.2 | 1.0 |
| 2004 | 82.6 | 11.0 | 1.3 | 0.2 | 0.2 | 1.2 | 3.0 | 0.7 |
| 2005 | 86.7 | 6.5 | 0.2 | 0.2 | 0.6 | 3.3 | 1.8 | 0.7 |
| Total Change |
+86.7% | +5.0% | -3.7% | -15.1% | -59.6% | -12.1% | -1.2% | 0.0% |

Click here to view larger image
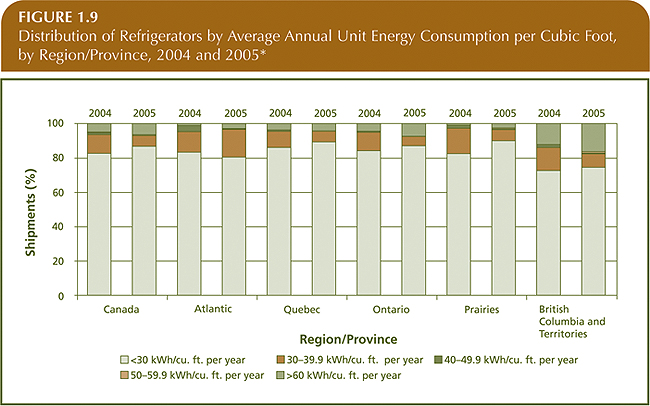
1.2.7 Distribution by Average Annual Unit Energy Consumption per Cubic Foot, by Region/Province
In 2005, 86.7 percent of all refrigerators shipped in Canada consumed less than 30 kWh/cu. ft. Figure 1.9 shows that, in 2005, consumers in British Columbia and the Territories continued to have a slight preference towards more energy-intensive refrigerators, compared with the rest of the country; 25.6 percent of refrigerators shipped there consumed more than 30 kWh/cu. ft. This could be attributed to the fact that they have a higher percentage of compact refrigerator shipments than other regions, which have been found to be less energy efficient (see Figure 1.12 and Table D.9 in Appendix D, "Detailed Tables").

Click here to view larger image
* For more information, see Table D.7 in Appendix D, "Detailed Tables."
1.3 Energy Consumption
1.3.1 Average Annual Unit Energy Consumption by Model Year
As mentioned previously, even though there is diversity in types and sizes of refrigerators, they have all been grouped to calculate the average UEC for all refrigerators by model year (see Figure 1.10). Overall, the UEC decreased by 487 kWh during the study period. Note the significant decrease in UEC from 2000 to 2005 (170.3 kWh per year), which coincides with the 2001 amendment to the MEPS. For analysis of the distribution of refrigerators by average annual UEC by type, see Table D.1 in Appendix D, "Detailed Tables." Because size is so important in such analysis, you are advised to also look further at the distribution of refrigerators by average annual UEC per cubic foot by volume (Table D.9 in Appendix D, "Detailed Tables").

* For more information, see Table D.1 in Appendix D, "Detailed Tables."
1.3.2 Average Annual Unit Energy Consumption by Volume
The energy performance of refrigerators improved remarkably between 1990 and 2005. As illustrated in Figure 1.11, the larger the volume, the greater the decrease in average annual UEC. The average annual UEC of refrigerators with volumes smaller than 5 cu. ft. remained relatively unchanged during the period.
In 1990, refrigerators larger than 16.5 cu. ft. consumed on average more than 1000 kWh of electricity per year. By 2005, refrigerators that size consumed less than half as much energy, and some of the largest units (28.5 to 30.4 cu. ft.) consumed, on average, only 628 kWh of electricity per year.
The gap between the average annual UEC of the largest and smallest units narrowed between 1990 and 2005. At the beginning of this period, the difference between the average annual UEC of the largest and smallest units was more than 1000 kWh. By 2005, with manufacturers improving the energy efficiency of larger models, the difference had shrunk to about 292 kWh. This trend demonstrates that there is less of a deterrent for purchasing larger units.

* For more information, see Table D.8 in Appendix D, "Detailed Tables."
The trend in the average annual UEC of refrigerators, on a per-cubic-foot basis, is consistent with the previous findings. Figure 1.12 shows that larger models consume less energy per cubic foot than smaller ones.

* For more information, see Table D.9 in Appendix D, "Detailed Tables."
1.3.3 Average Annual Unit Energy Consumption by Channel, by Region/Province
Figure 1.13 demonstrates the breakdown of the average annual UEC of refrigerators by shipments for retail purposes and for the builder trade by region/province for 2004 and 2005. In all regions, the average annual UEC decreased slightly for retail and builder shipments. It seems that builders in the Atlantic provinces and Quebec are providing their customers with more energy-efficient refrigerators. This chart also shows that in most regions, the average annual UEC remained higher for refrigerators tagged for retail shipments. Retail refrigerators are generally larger and, therefore, consume more energy. In British Columbia and the Territories, however, the average annual UEC remained higher for refrigerators shipped to the builder trade. This is partly because builders in this region continued to provide their clients with larger refrigerators (those more than 16.5 cu. ft.) than those provided by builders in the rest of the country.

Click here to view larger image
* For more information, see Table D.10 in Appendix D, "Detailed Tables."
Figure 1.14 demonstrates that nationally, there was a slight increase in builder and retail shipments of refrigerators consuming less than 30 kWh/cu. ft. per year, from 2004 to 2005. It also shows fluctuations of these proportions throughout the provinces/regions. For example, builder shipments in Quebec and retail shipments in British Columbia and the Territories were somewhat more energy-intensive than the national average in 2004 and 2005.

Click here to view larger image
* For more information, see Table D.11 in Appendix D, "Detailed Tables."
1.4 Energy Savings
Figure 1.15 shows how much energy refrigerators might have consumed annually between 1992 and 2005 without the decrease in average annual UEC (top line) and how much energy refrigerators actually consumed during those years (bottom line).
The divergence of the two lines in Figure 1.15 represents incremental annual energy savings. Even though the MEPS did not come into effect until 1995, the calculation of energy savings is based on data from 1992 onward. This is because energy efficiency began to improve almost immediately after the Energy Efficiency Act came into force in 1992, thanks to such market forces as the regulations expected from the Act and United States regulations.

* For more information, see Table D.12 in Appendix D, "Detailed Tables."
The average annual energy savings for refrigerators were estimated to be 0.9 petajoules (PJ) between 1993 and 2005. (No savings were expected in 1992.) This indicates that, on average, refrigerators consumed about 0.9 PJ less per year than they would have without the factors described above.
Cumulative energy savings for refrigerators are shown in Figure 1.16 and in Table D.12 in Appendix D, "Detailed Tables." In 2005, refrigerators consumed about 1.61 PJ less than they would have otherwise. They reached a total savings of 11.13 PJ in 2005, taking into account the life expectancy factor of refrigerators. (This calculation is explained further in Appendix A, "Methodology.")

Refrigerators Summary
Type 3 refrigerators (refrigerator-freezers with a top-mounted freezer and automatic defrost) remained the most popular type in Canada (64.8 percent of the market in 2005). However, their market share had declined since 1990, when they represented 84.9 percent of the market. Shipments of refrigerators with a bottom-mounted freezer (Type 5) continued to rise in popularity in 2005, and refrigerators with a side-mounted freezer and through-the-door ice service (Type 7) remained popular.
Of the refrigerators shipped in 2005, 37.6 percent were ENERGY STAR qualified. Table D.A.1 in Appendix D, "Detailed Tables," shows that 2004 and 2005 shipments of ENERGY STAR refrigerators were down slightly from 2003. This decrease is due to the introduction in 2004 of more stringent specifications for refrigerators to qualify for the ENERGY STAR registered mark.
In 2005, the most popular size category of refrigerators was 16.5 to 18.4 cu. ft., although there remained a continued trend for larger ones (those more than 18.5 cu. ft.). Refrigerators, however, were becoming more efficient – from 2000 to 2005, the market share of refrigerators requiring less than 30 kWh per cu. ft. increased from 12.2 percent to 86.7 percent. As mentioned previously in this chapter, the larger the volume capacity of refrigerators shipped in 2005, the greater the decrease in their average annual UEC.
In 2005, 83.0 percent of all refrigerators were categorized as retail shipments, whereas 17.0 percent of them were tagged as builder shipments. British Columbia and the Territories continued to have a substantially larger share of builder shipments than the rest of the country, whereas Quebec continued to have a somewhat smaller builder share.
The average annual energy savings for refrigerators were estimated to be 0.9 PJ between 1992 and 2005, with total energy savings for that period reaching 11.13 PJ (3.09 billion kWh). Dollar savings for refrigerators for the study period were estimated to be $284 million (calculated at 9.2 cents/kWh).
22 The term "all-refrigerators" refers to models that have no freezer compartment.
23 Retail sales include those by Canadian manufacturers and importers and/or their branches and distributors to Canadian retailers and other consumers, but do not include sales to branches or to other Canadian Appliance Manufacturers Association member companies.
24 Builder sales include those to home, row house or apartment builders; motels; governments; trailer manufacturers; and property management.
25 Natural Resources Canada, 2003 Survey of Household Energy Use, Detailed Statistical Report (Ottawa: 2006), Table 5.1, p. 57. Available: oee.nrcan.gc.ca/Publications/statistics/sheu03/pdf/sheu03.pdf.
26 For more information about the 2001 amendment to the MEPS for refrigerators, visit the following Web site: oee.nrcan.gc.ca/regulations/refrigerators.cfm.