
Natural Resources Canada
www.nrcan.gc.ca
Common menu bar links
Office of Energy Efficiency Links
Office of Energy Efficiency
Menu
Improving Energy Performance in Canada – Report to Parliament Under the Energy Efficiency Act For the Fiscal Year 2009-2010
PDF Version | Table of Contents | Next Page
Chapter 1 Trends in Energy Use
Introduction
Canadians enjoy an abundance of energy from a variety of sources. This comparative advantage in the supply of energy helps Canadians deal with the economic disadvantages of small domestic markets, long distances, rugged geography and a relatively harsh climate. It also fosters the development of industries with a particularly strong energy demand.
Canadians spent about $166 billion in 2007 on energy to heat and cool their homes and offices and to operate their appliances, vehicles and industrial processes. This amount is equivalent to almost 12 percent of the country’s gross domestic product (GDP).²
Energy Use and Greenhouse Gas Emissions
Energy use is of two general types: primary and secondary. Primary energy use encompasses the total requirements for all users of energy, the energy required to transform one energy form to another (e.g. coal to electricity) and the energy used to bring energy supplies to the consumer. Secondary energy use is energy used by final consumers for residential, commercial/institutional, industrial, transportation and agricultural purposes.
Primary energy use represents the total requirements for all users of energy, including secondary energy use. In Canada, the increase in primary energy use reflects changes over several decades in energy-consuming equipment and buildings and in the behaviour of energy users. Primary energy use was 12 786 petajoules³ (PJ) in 2007.
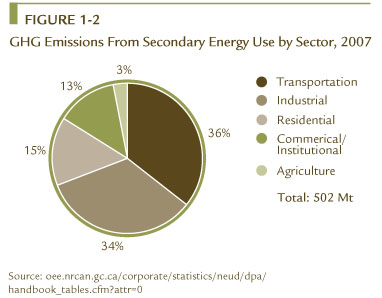
Secondary energy use accounted for 69 percent of primary energy use in 2007, or 8870.5 PJ. It was responsible for 67 percent (501.6 megatonnes [Mt]) of total greenhouse gas (GHG) emissions in Canada, including indirect emissions – those produced by electric utilities to meet end-use electrical demand.
From 1990 to 2007, secondary energy use increased by 28 percent, the Canadian population grew 19 percent, and the GDP increased 58 percent. Thus energy use grew less rapidly than the economy but more rapidly than the population.
As demonstrated in Figure 1-1, the industrial sector was the largest energy user, accounting for 39 percent of total secondary energy use in 2007. The transportation sector was the second largest energy user at 29 percent, followed by the residential sector at 16 percent, the commercial/institutional sector at 13 percent and the agricultural sector at 2 percent.

Source: oee.rncan.gc.ca/corporate/statistics/neud/dpa/handbook_tables.cfm
Figure 1-2 illustrates the distribution of GHG emissions by sector. This report deals with energy-related GHG emissions, which comprise carbon dioxide (CO2), methane and nitrous oxide. CO2 accounts for most of Canada’s GHG emissions. All subsequent references in this report to CO2 and GHGs include emissions that are attributable directly to secondary energy use and emissions that are attributable indirectly to electricity generation, unless otherwise specified.
Source: oee.rncan.gc.ca/corporate/statistics/neud/dpa/handbook_tables.cfm
Energy Intensity and Energy Efficiency
The term “energy intensity” refers to the amount of energy use per unit of activity. Energy intensity is sometimes used as a proxy for energy efficiency because it is a simple calculation for which data are readily available. However, this measure can be misleading because, in addition to pure energy efficiency, intensity captures the impact of other factors that influence energy demand, such as weather variations and changes in the structure of the economy.
Energy efficiency refers to how effectively energy is being used for a given purpose. For example, providing a similar (or better) level of service with less energy consumption on a per-unit basis is considered an improvement in energy efficiency.
To properly gauge changes in energy efficiency over time, differences in economic structure and weather need to be normalized or factored out of the intensity calculation. Natural Resources Canada’s (NRCan’s) Office of Energy Efficiency (OEE) applies an internationally recognized factorization analysis technique – the Log-Mean Divisia Index I methodology – to isolate the impact of energy efficiency on changes in Canadian energy use.
Figure 1-3 compares, for Canada, an index of annual variation in energy intensity with the OEE’s index of changes in energy efficiency from 1990 to 2007. As illustrated, Canada’s energy intensity and efficiency improved over this period. The reduction in energy intensity reflects an overall improvement in energy efficiency or how effectively energy is being used in producing one unit of GDP. At the same time, the improvement in energy efficiency indicates how effectively energy is being used to provide a certain level of service or output.

As illustrated in Figure 1-3, intensity underestimates the efficiency effect in Canada in the early 1990s and overestimates its impact in the latter part of the period. Before 1998, intensity improvements appear to be modest because colder weather (1992–1997) and a shift toward more energy-intensive industries (1990–1996) masked energy efficiency progress. In 2000, the intensity index dipped below the index for the energy efficiency effect. A switch to less energy-intensive industries, which began in the mid-1990s, combined with energy efficiency improvements accelerated the decline in energy intensity.
Trends in Energy Efficiency
NRCan regularly publishes Energy Efficiency Trends in Canada, which reports on changes in energy use and GHG emissions and the contributions of the following key factors to these changes (see Table 1-1):
- Increases in sector activity lead to increased energy use and GHG emissions. Activity is defined differently in each sector. For example, in the residential sector, it is defined as the number of households and the floor space of residences. In the industrial sector, it is defined as industrial GDP, gross output and physical industrial output, such as tonnes of steel.
- Fluctuations in weather lead to changes in space-heating and space-cooling requirements. A colder winter or a warmer summer can lead to increased energy use.
- A shift in the structure of activity toward more energy-intensive components of activity leads to increased energy use and emissions. For example, if the distribution of activity in the industrial sector shifts from forestry to the iron and steel industry, industrial energy use will increase because the former sector is less energy intensive than the latter.
- Service level refers to the penetration rate of electrical devices and equipment, for example, the use of auxiliary equipment in commercial/institutional buildings and appliances in homes or the amount of floor space cooled.
- Energy efficiency effect indicates how effectively energy is being used, for example, the degree to which less energy is being used to provide the same level of energy service. Energy efficiency gains occur primarily with improvements in technology or processes. An example of such an improvement would be replacing incandescent lights with compact fluorescent lamps.
| Sectors | ||||||
|---|---|---|---|---|---|---|
| Residential | Commercial/ Institutional |
Industrial | Transportation | Total* | Change (%) |
|
| 1990 energy use (PJ) | 1282.3 | 867.0 | 2710.0 | 1877.9 | 6936.3 | |
| 2007 energy use (PJ) | 1447.2 | 1141.6 | 3471.6 | 2595.2 | 8870.5 | |
| Change in energy use (PJ) |
164.9 | 274.6 | 761.6 | 717.3 | 1934.2 | 27.9 |
| Source: oee.nrcan.gc.ca/corporate/statistics/neud/dpa/handbook_tables.cfm?attr=0 | ||||||
| Explanatory factor (change due to) | ||||||
| Activity | 456.4 | 294.7 | 1261.7 | 853.8 | 2866.6 | 41.3 |
| Weather | 15.0 | 15.2 | n/a | n/a | 30.2 | 0.4 |
| Structure | 0.6 | 0.3 | -315.3 | 218.5 | -95.8 | -1.4 |
| Service level | 71.1 | 103.6 | n/a | n/a | 174.7 | 2.5 |
| Energy efficiency | -378.2 | -138.7 | -184.8 | -388.0 | -1089.7 | -15.7 |
| Other factors | -0.5 | 48.3 | 0.7 | |||
| Source: oee.nrcan.gc.ca/corporate/statistics/neud/dpa/analysis_ca.cfm?attr=0 | ||||||
*Total also includes energy use for agriculture.
In this report, changes in energy efficiency are the net result after allowing for changes in energy use due to activity, weather, structure and service level. However, other factors, such as individual consumer choice, may affect energy use and are not captured by the above standardized factors. The effects of activity, weather, structure and service level may overstate or understate the “actual” change in energy use and energy efficiency improvements.
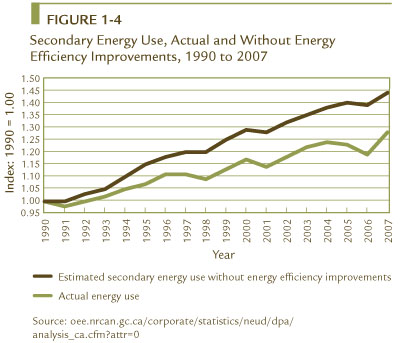
Between 1990 and 2007, secondary energy use in Canada increased from 6936.3 to 8870.5 PJ. Without improvements in energy efficiency, increases attributable to activity, weather, structure and service level would have led to an energy increase of 44 percent. However, as a result of a 16 percent (1090 PJ) improvement in energy efficiency,4 actual secondary energy use increased by only 28 percent (to 8870.5 PJ). This improvement in energy efficiency is estimated to have reduced GHG emissions by 63 Mt and decreased energy expenditures by $22.8 billion in 2007. The change in energy use between 1990 and 2007, actual and without energy efficiency improvements, is shown in Figure 1-4.
Source: oee.rncan.gc.ca/corporate/statistics/neud/dpa/analysis_ca.cfm
Trends in Renewable Energy
Canada is a leader in the production of renewable energy, with over 16 percent of its primary energy supply coming from renewable energy sources in 2008. Although renewable energy is often associated with electricity, renewable energy sources also produce thermal energy (heat) and transportation fuels. Renewable energy sources in Canada include inland and ocean water, wind, solar, geothermal and biomass.
Canada has a significant renewable electricity supply due primarily to the widespread use of hydroelectricity. In 2008, 60.4 percent of Canada’s electricity generation was provided by conventional and small hydroelectric plants, which generated more than 376 terawatt hours (TWh) of electricity, up 3.3 percent from 364 TWh in 2007. Small hydro plants (less than 50 megawatts [MW]), with installed generating capacity of 3452 MW, provided about 2 percent of the total electricity generation in Canada.
Several provinces are taking steps to support the development of the next generation of ocean renewable energy technologies, which use waves, ocean currents and tides to generate electricity.
In 2010, the Fundy Ocean Resource Centre for Energy, a technology demonstration facility, started testing three technologies with a total capacity of 4 MW. Wave and tidal-current technologies are also being tested off the coast of British Columbia, and a commercial facility for generating electricity may be feasible within the next decade.
Although technical, regulatory and financial challenges remain, ocean energy has the potential to provide Canada with an abundant source of renewable energy.
Non-hydro renewable sources accounted for an estimated 2 percent of Canada’s electricity generation. With 1516 MW of installed capacity in 2008, biomass (waste and virgin biomass and landfill gas) is one of the main non-hydro renewable energy sources in Canada.
Wind energy is growing rapidly, with an increase in capacity from 139 MW in 2000 to 3319 MW in 2009. Wind power may soon be moving to the offshore, with large projects planned on submerged lands off the coast of British Columbia and in the Great Lakes.
Solar photovoltaic (PV) energy also experienced high rates of capacity growth – about 32 percent average growth rate annually between 1992 and 2009 – although it started from a very low baseline. 2009 was the best year so far for solar PV, with approximately 95 MW of solar PV systems installed in Canada, representing an increase of 62 MW from the previous year.
The Canadian active solar thermal installed capacity in 2008 was 720 000 square metres (m²), which is approximately 500 megawatts thermal (MWth). The domestic market increase has averaged 13 percent annually since 1998. In 2008, the solar thermal collector market in Canada was 139 159 m², more than twice the installations in 2007 (60 900 m²), with revenues up 44 percent from 2007.
In 2008, 15 000 ground-source heat pumps (GSHP) units were installed in Canada. This is a large increase from the 9100 units installed in 2007 and 4217 units installed in 2006. As of December 31, 2009, there were approximately 46 000 GSHPs with 555 MWth of installed capacity producing an estimated 760 gigawatt-hours equivalent annually.
As described in Chapter 5, NRCan is carrying out three initiatives – ecoENERGY for Renewable Power, ecoENERGY for Renewable Heat and the Pulp and Paper Green Transformation Program – to increase the use of renewable energy in Canada.
Trends in Residential Sector
Energy Use and Greenhouse Gas Emissions
The residential sector includes four major types of dwellings: single detached, single attached, apartments and mobile homes. Energy is used in dwellings for space heating and cooling; water heating; and the operation of appliances, electronic equipment and lights. In 2007, this sector accounted for 16 percent (1447.2 PJ) of secondary energy use and 15 percent (74.3 Mt) of GHGs emitted in Canada.
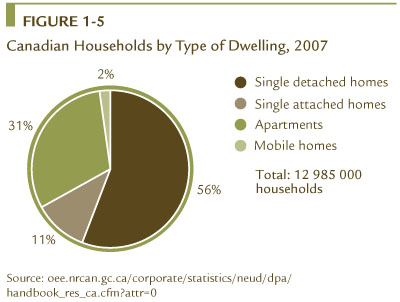
Most dwellings in Canada are single detached houses. The next largest type of dwelling is apartments, followed by single attached dwellings and mobile homes (see Figure 1-5). The OEE’s ecoENERGY Retrofit – Homes and ecoENERGY for Buildings and Houses programs aim to improve the energy efficiency of single detached and attached houses.
Source: oee.rncan.gc.ca/corporate/statistics/neud/dpa/handbook_res_ca.cfm
Between 1990 and 2007, residential energy use increased by 13 percent, or 164.9 PJ. For the same period , GHG emissions increased by 11 percent.
GHG intensity decreased 2 percent despite the average household operating more appliances, becoming larger and increasing its use of space cooling. Space and water heating constituted 81 percent of residential energy use (which exhibited a small drop in space-heating energy use), followed by operating appliances, lighting and space cooling (see Figure 1-6).

Source: oee.rncan.gc.ca/corporate/statistics/neud/dpa/handbook_res_ca.cfm
Five main factors influenced residential energy use between 1990 and 2007 – activity, weather, structure, service level and energy efficiency effect:
- Activity – As measured by combining a mix of households and floor space, energy use increased 36 percent (456.4 PJ). Growth in activity was driven by a 44 percent increase in floor area and by a rise of 31 percent in the number of households.
- Weather – In 2007, winter temperatures were similar to those of 1990 but the summer was warmer. The net result was an overall increase in energy demand for temperature control of 15.0 PJ.
- Structure – The increase in the relative share of households by dwelling type resulted in the sector using an additional 0.6 PJ of energy.
- Service level – The increased penetration rate of appliances and the increased floor space cooled by space cooling units were responsible for 71.1 PJ of the increase in energy.
- Energy efficiency effect – Improvements to the thermal envelope of houses and to the efficiency of residential appliances and space-and water- heating equipment led to an overall energy efficiency gain in the residential sector. This efficiency gain saved 378.2 PJ of energy.
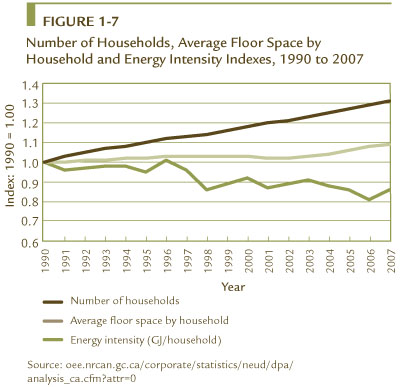
Growth in residential energy use was driven in large part by growth in activity. This growth in activity – specifically, growth in total floor space and number of households – was due to the increase in the average size of newly constructed houses, the rising population and the trend toward fewer individuals per household (see Figure 1-7).
Source: oee.rncan.gc.ca/corporate/statistics/neud/dpa/analysis_ca.cfm
These increases were partially offset by significant improvements in energy efficiency. Service level increased energy demand because more Canadians cooled their homes during the summer months in 2007 than in 1990, and Canadians operated more appliances in 2007 than they did in 1990.
Energy Efficiency
The change in residential energy use between 1990 and 2007 and the estimated energy savings due to energy efficiency measures are shown in Figure 1-8.
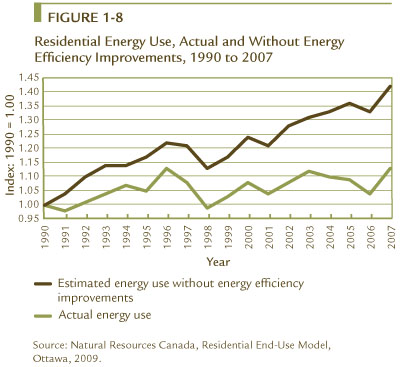
Overall, energy efficiency upgrades – including improvements to the thermal envelope (insulations, windows, etc.) and more energy-efficient appliances, furnaces and lighting – resulted in significant monetary savings for each Canadian household.
The 29 percent improvement in energy efficiency between 1990 and 2007 translated into $7.4 billion in energy savings in 2007.
Figure 1-9 shows how energy consumption differs for houses built in different periods, reflecting improvements in building construction.
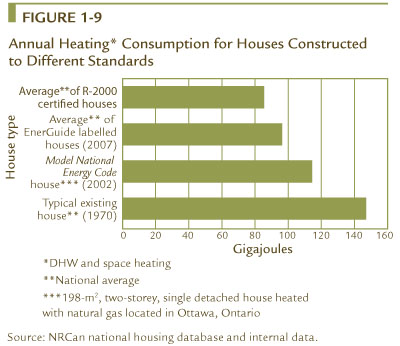
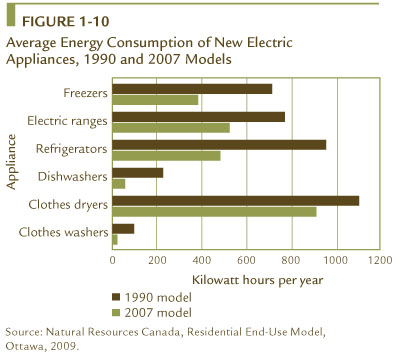
Figure 1-10 shows how average energy consumption of new appliances has improved, by comparing 1990 and 2007 models.
NRCan carries out the following initiatives to increase energy efficiency in the residential sector:
- ecoENERGY Retrofit – Homes
- ecoENERGY for Buildings and Houses
- Clean Energy Systems for Buildings and Communities
- ecoENERGY for Equipment (see Chapter 2)
Trends in Commercial/Institutional Sector
Energy Use and Greenhouse Gas Emissions
The commercial/institutional sector includes activity related to trade, finance, real estate, public administration, education and commercial services, including tourism. This sector uses energy mainly for space and water heating, operation of auxiliary equipment, space cooling, lighting, motive power for such services as pumping and ventilation in buildings, and street lighting.
In 2007, the commercial/institutional sector accounted for 13 percent (1142 PJ) of secondary energy use and GHG emissions in Canada. Between 1990 and 2007, commercial/institutional energy use (including street lighting) increased by 32 percent, or 275 PJ. GHG emissions from the sector rose by 36 percent in the same period. The increase in use of GHG-intensive fuels, such as heavy oil and light fuel oil, explains why GHG emissions grew at a faster pace than energy use.
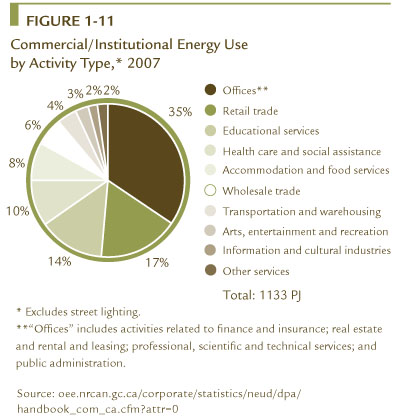
To highlight energy use in commercial/institutional activities, the following analysis excludes energy use for street lighting. The commercial/institutional sector comprises many activity types (see Figure 1-11). In 2007, offices accounted for 35 percent of the sector’s energy demand. Retail trade, educational services, health care and social assistance, and accommodation and food services accounted for another 49 percent of that demand.
Source: oee.rncan.gc.ca/corporate/statistics/neud/dpa/handbook_com_ca.cfm
Energy is used for seven purposes in commercial/institutional activities. As illustrated in Figure 1-12, in 2007, the largest of these was space heating, which accounted for half of the energy use in the sector. The remaining six uses of energy accounted for between 1 percent and 17 percent of energy demand in the sector.
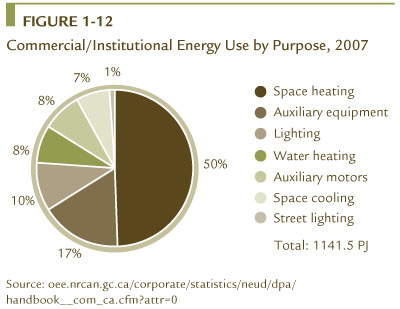
Source: oee.rncan.gc.ca/corporate/statistics/neud/dpa/handbook_com_ca.cfm
Five main factors influenced commercial/institutional energy use between 1990 and 2007 – activity, weather, structure, service level and energy efficiency effect:
- Activity – An increase in floor space raised energy use by 34 percent (294.7 PJ) and increased GHG-related emissions by 16.7 Mt.
- Structure – The effect of structure changes in the sector (the mix of activity types) was small and therefore changed GHG-related emissions only marginally.
- Weather – The winter of 2007 was similar to the winter of 1990, but the summer was warmer. The net result was a 15.2-PJ increase in energy demand in the commercial/institutional sector, mainly for space conditioning, which had the effect of increasing GHG-related emissions by 0.9 Mt.
- Service level – An increase in space cooling and in the service level of auxiliary equipment, which is the penetration rates of office equipment (e.g. computers, fax machines and photocopiers), led to a 103.6-PJ increase in energy use and a 5.9-Mt increase in GHG-related emissions.
- Energy efficiency effect – Improvements in the energy efficiency of the commercial/institutional sector saved 138.7 PJ of energy and 7.8 Mt of related emissions.
Energy Efficiency
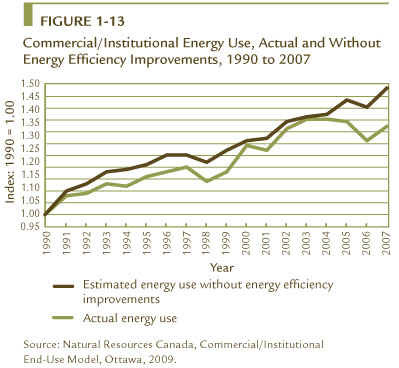
Gains in energy efficiency were made through improvements to the thermal envelope of buildings (insulation, windows, etc.) and increased efficiency of energy-consuming items, such as furnaces, auxiliary equipment and lighting, which slowed the rate of increase in energy use. Without improvements in energy efficiency, energy use in the commercial/institutional sector would have increased by 48 percent. However, actual energy use increased by only 32 percent between 1990 and 2007, resulting in energy savings of $2.9 billion in 2007.
The change in energy use between 1990 and 2007, as well as the estimated energy savings due to improvements in energy efficiency, are shown in Figure 1-13.
NRCan carries out the following initiatives to increase energy efficiency in the commercial/institutional sector:
- ecoENERGY Retrofit – Small and Medium Organizations
- ecoENERGY for Buildings and Houses
- Clean Energy Systems for Buildings and Communities
- ecoENERGY for Equipment (See Chapter 2)
Trends in Industrial Sector
Energy Use and Greenhouse Gas Emissions
The industrial sector includes all manufacturing industries, all mining activities (including oil and gas extraction), forestry and construction. However, it excludes electricity generation. This sector uses energy in industrial processes as a source of motive power and to produce heat or generate steam.
Overall, industrial energy demand in 2007 accounted for 39 percent (3472 PJ) of secondary energy use and 34 percent (169 Mt) of GHG emissions (including electricity-related emissions). Between 1990 and 2007, actual industrial energy use increased by 28 percent (762 PJ). This increase was caused by the increase in industrial activity, measured as a combination of physical units of production, gross output and GDP.
In the industrial sector, energy was consumed primarily in mining, other manufacturing, pulp and paper production, and the petroleum refining industries. Mining alone accounted for 25 percent of total industrial energy demand in 2007 (see Figure 1-14).
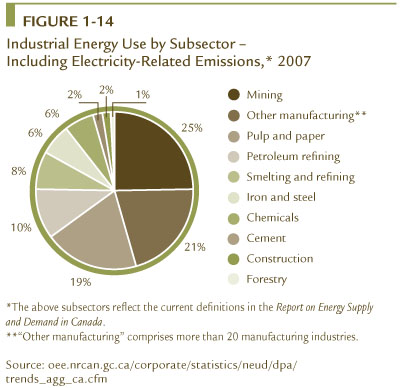
Source: oee.rncan.gc.ca/corporate/statistics/neud/dpa/trends_agg_ca.cfm
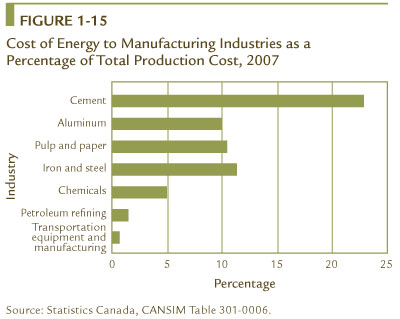
In most industries, energy purchases accounted for only a small portion of total expenditures. However, for some relatively energy-intensive industries – cement, aluminium, pulp and paper, and iron and steel – this share was 10 percent or higher (see Figure 1-15). For cement, in particular, the share was 23 percent.
Between 1990 and 2007, industrial GHG emissions, including electricity-related emissions, increased by 24 percent. Excluding electricity-related emissions, industrial GHG emissions increased by 19 percent. Most of this increase in direct GHG emissions occurred in the upstream oil and gas industry. The pulp and paper industry, however, achieved a 28 percent decrease in GHG emissions.
Three main factors influenced industrial energy use between 1990 and 2007 – activity, structure and energy efficiency effect:
- Activity – The mix of GDP, gross output and production units (activity measures) increased the energy use by 75 percent, or 1261.7 PJ.
- Structure – The structural changes in the industrial sector, specifically a relative decrease in the activity share of energy-intensive industries, helped the sector reduce its energy use by 315.3 PJ. Note that industries consuming more than 6 megajoules5 per dollar of GDP (e.g. pulp and paper, petroleum refining, upstream mining) represented 28 percent of industrial GDP in 1990. They accounted for 25 percent in 2007.
- Energy efficiency effect – Improvements in the energy efficiency of the industrial sector avoided 184.8 PJ of energy use.
Energy Efficiency
The change in energy use between 1990 and 2007 and the estimated energy savings attributed to energy efficiency are shown in Figure 1-16.
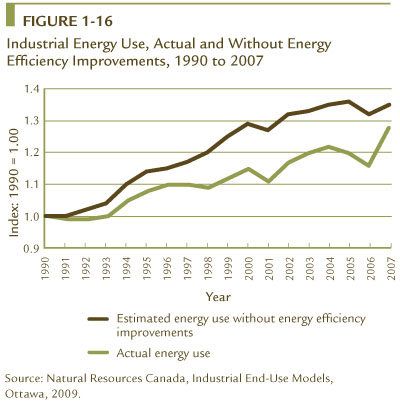
Energy efficiency improvements in the form of more efficient capital and management practices are important factors in managing energy use and decreasing energy intensity.
Between 1990 and 2007, energy efficiency in the industrial sector improved 7 percent. In 2007, Canadian industry saved $2.1 billion in energy costs. This gain was largely the result of improvements in energy intensity, representing the shift toward less energy-intensive activities. However, energy savings from the energy efficiency improvements made by some industries were offset by increases in consumption by the upstream oil and gas, fertilizer and forestry subsectors.
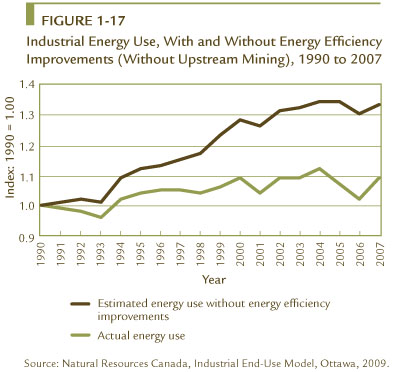
From 1990 to 2007, the upstream mining share of industrial energy use grew from 8 percent to 22 percent. This change reflects not only growth in production but also a shift from conventional to the significantly more energy-intensive unconventional oil production. Netting out the upstream mining, Canadian industries improved energy efficiency by 23 percent, which represents 617.7 PJ of savings (see Figure 1-17) and corresponds to $7 billion in avoided energy costs.
NRCan carries out the following initiatives to increase energy efficiency in the industrial sector:
- ecoENERGY Retrofit – Small and Medium Organizations
- ecoENERGY for Industry
- Clean Energy Systems for Industry
- ecoENERGY for Equipment (see Chapter 2)
Trends in Transportation
Energy Use and Greenhouse Gas Emissions
In 2007, transportation was second to the industrial sector in terms of energy use, accounting for 29 percent (2595 PJ) of Canada’s total secondary energy use and the largest portion of Canadian end-use GHG emissions at 36 percent (179.4 Mt).
Transportation accounts for a greater share of GHG emissions because the main fuels used by the sector are more GHG-intensive than those used in other sectors of the economy.
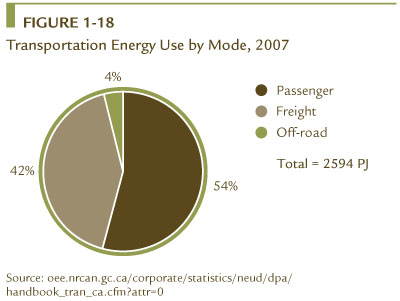
The transportation sector consists of three subsectors: passenger, freight and off-road. In 2007, passenger and freight transportation accounted for 54 percent and 42 percent of transportation energy use respectively, while off-road represented only 4 percent (see Figure 1-18). Owing to limitations in the available data and the small percentage it accounts for, the off-road subsector is not analysed in further detail.
Source: oee.rncan.gc.ca/corporate/statistics/neud/dpa/handbook_tran_ca.cfm
The passenger subsector has three modes: road, rail and air. The freight subsector, as defined by NRCan, is composed of road, rail, air and marine modes. All of NRCan’s transportation energy use programs focus on the energy used in road transportation. Total transportation energy use increased by 38 percent (717 PJ) between 1990 and 2007. Within the transportation sector, passenger transportation energy use increased by 19 percent (228 PJ), while freight transportation energy use increased by 70 percent (445 PJ).
Three main factors influenced passenger transportation energy use between 1990 and 2007 – activity, structure and energy efficiency effect:
- Activity – The activity effect (i.e. passenger-kilometres [Pkm] travelled) increased energy use by 38 percent, or 433.2 PJ, with a corresponding 29.4-Mt increase in GHG emissions. Light truck and air transportation led the growth in Pkm (and therefore, activity effect), with respective increases of 165 percent and 89 percent.
- Structure – Changes to the mix of transportation modes, or the relative share of Pkm travelled by air, rail and road, are used to measure changes in structure. The popularity of minivans and sport utility vehicles (SUVs) increased the activity share of light trucks compared with other modes, contributing to a 33.8-PJ increase in energy consumption and a 2.3-Mt increase in GHG emissions.
- Energy efficiency effect – Improvements in the energy efficiency of passenger transportation saved 227.9 PJ of energy and 15.5 Mt of energy-related GHG emissions. Despite the increasing popularity of larger and heavier light-duty vehicles with greater horsepower, the light-duty vehicle segment (cars, light trucks and motorcycles) of passenger transportation was able to show 172.5 PJ of energy savings.
Three main factors influenced freight transportation energy use between 1990 and 2007 – activity, structure and energy efficiency effect:
- Activity – The activity effect (i.e. tonne-kilometres moved) increased energy use 66 percent, or 420.6 PJ, and caused a corresponding 29.8-Mt increase in GHG emissions. This increase was influenced by greater international trade and the deregulation of the trucking and rail industries.
- Structure – Changes in the structure of freight transportation (shifts in activity between modes) stemmed from growth in international trade and customer requirements for just-in-time delivery. The shift between modes was the increase in the share of freight moved by heavy trucks relative to other modes. Because trucks are more energy intensive per tonne-kilometre than other modes, the sector used an additional 184.8 PJ of energy and emitted 13.1 Mt more GHG emissions.
- Energy efficiency effect – Improvements in the energy efficiency of freight transportation saved 160.1 PJ of energy and 11.3 Mt of GHG emissions. Improvements in freight trucks were a large contributor, saving 101.1 PJ.
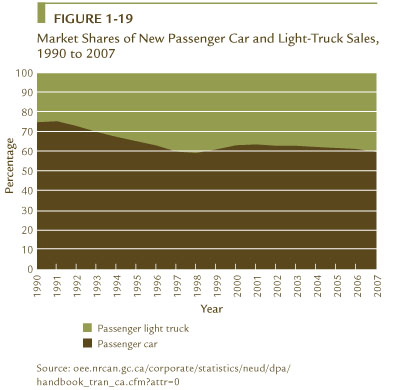
Figure 1-19 shows how the market share of new light trucks increased in the 1990s, reflecting the increase in popularity of minivans and SUVs. Recently, however, this trend seems to have stabilized, with the share of light trucks remaining steady over the past few years. The higher share of heavier and more powerful passenger vehicles has had a significant effect on the increase in passenger energy use.
Source: oee.rncan.gc.ca/corporate/statistics/neud/dpa/handbook_tran_ca.cfm
Energy Efficiency
Without improvements in energy efficiency, increases attributable to activity and structure would have led to an increase in transportation energy use of 59 percent. However, between 1990 and 2007, actual energy use increased by 38 percent. During this period, energy efficiency in the transportation sector improved by 22 percent, leading to a savings of $10.3 billion in 2007. This change in energy use between 1990 and 2007 and the estimated energy savings due to energy efficiency improvements are shown in Figure 1-20.
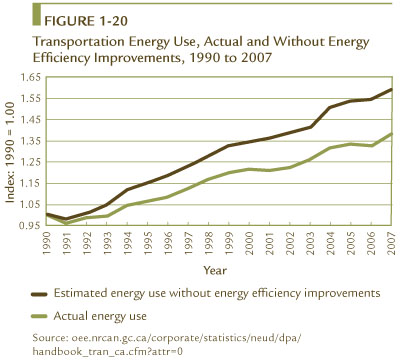
Source: oee.rncan.gc.ca/corporate/statistics/neud/dpa/handbook_tran_ca.cfm
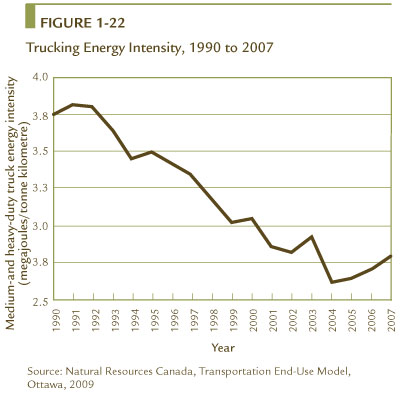
Figures 1-21 and 1-22 illustrate an improvement in trucking energy intensity despite an increase in average activity from 1990 to 2007. Improved fleet practices, caused by an increase in the competitiveness of the transportation sector and by the introduction of electronic engines, have improved fuel efficiency in medium- and heavy-duty trucks.
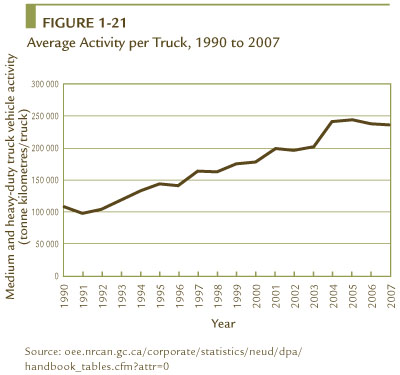
Source: oee.rncan.gc.ca/corporate/statistics/neud/dpa/handbook_tran_ca.cfm
NRCan carries out the following initiatives to increase the efficiency of motor vehicle use:
- ecoENERGY for Personal Vehicles
- ecoENERGY for Fleets
- Clean Transportation Energy
Trends in Alternative and Renewable Fuels
Alternative and Renewable Fuels
Alternative fuels are fuels used for transportation other than petroleum-based gasoline and diesel. Some alternative transportation fuels, such as ethanol and biodiesel, are renewable; others, such as propane and natural gas, are non-renewable. Other possible alternative transportation fuels include next-generation biofuels, coal-to-liquids, electricity and hydrogen.
Renewable fuel is a broad term covering a range of fuels made from renewable energy sources that are naturally replenished in a relatively short period. The sources include biomass, hydropower, geothermal energy, wind energy and solar energy.
Biofuel is a well-known category of renewable fuel and can be produced from a variety of sources. Two commercially available biofuels are ethanol and biodiesel. Conventional ethanol is produced from sugars or starches, and biodiesel production typically uses vegetable oils and animal fats. In Canada, ethanol is typically produced from corn and wheat, while canola oil, soy oil and tallow are relevant biodiesel feedstocks.
Gasoline vehicles manufactured since the 1980s can use up to 10 percent ethanol in gasoline. An increasing number of original equipment manufacturers are endorsing the use of lower biodiesel blends, for example, up to 5 percent in diesel engines. Under development are next-generation biofuels, such as cellulosic ethanol. These biofuels could be made from non-conventional sources, such as agricultural residues, forest residues and waste materials.
Renewable Fuels Production
Renewable fuels production in Canada has increased since the emergence of ethanol in Manitoba in the 1980s. Between 2005 and 2009, domestic renewable fuel production capacity increased approximately eightfold, from 211 million litres (L) to 1.65 billion L per year. By the end of 2009, ethanol production capacity was 1.5 billion L and biodiesel production capacity was more than 150 million L. For the 2009 calendar year, 1.1 billion L of ethanol and approximately 102 million L of biodiesel were actually produced.
In 2008, renewable fuels used in the transportation sector represented an estimated 2 percent of fuel used. The renewable fuel consumed was predominately ethanol blended with gasoline in lower-level ethanol blends.
Environment Canada announced that the Renewable Fuels Regulations requiring gasoline producers and importers to have an annual average renewable fuel content of at least five percent based on the volume of gasoline produced and imported came into force on December 15, 2010. The federal government also intends to regulate a 2 percent requirement for renewable content in diesel fuel and heating oil by 2011, subject to technical feasibility.
NRCan carries out initiatives to increase the use and production of renewable and alternative fuels under the following programs:
- ecoENERGY for Biofuels
- National Renewable Diesel Demonstration Initiative
- Sustainable Development Technology Canada’s NextGen Biofuels FundTM
² Data in this chapter are presented for 1990–2007. Readers are encouraged to consult the Office of Energy Efficiency Web site to view data updates as they become available.
3 One petajoule equals 1 × 10¹⁵ joules.
4 Based on the OEE Index.
5 One megajoule equals 1 × 10⁶ joules.