Natural Resources Canada
www.nrcan.gc.ca
Common menu bar links
Office of Energy Efficiency Links
Office of Energy Efficiency
Menu
Canadian Vehicle Survey 2007 Summary Report
Chapter 3. Light vehicles
More than 96 percent of the vehicles on Canadian roads falls under the category of light vehicles. The light vehicle fleet consists of cars, station wagons, vans, sport utility vehicles (SUVs) and pickup trucks. These vehicles are used primarily for private purposes. In 2007, more than 80 percent of the vehicle-kilometres travelled by light vehicles constituted trips unrelated to the driver’s work.
3.1 Light vehicles: Vehicle body type
The two categories of vehicle body type in the light vehicle category are as follows:
- passenger vehicles, including cars and station wagons
- light trucks, including vans, SUVs and pickup trucks
Table 3.1 shows the body types in the light vehicle fleet for 2007. Cars made up half of the fleet (53 percent), followed by pickup trucks (20 percent), vans (16 percent) and SUVs (10 percent). Vans had a higher number of passenger-kilometres than pickup trucks and SUVs. This finding can be explained by the van’s popularity as a family vehicle and its ability to accommodate more passengers than other light vehicles. SUVs accounted for less than 10 percent of the light vehicle fleet and less than 13 percent of the distance travelled in 2007.
Table 3.1 Light vehicles by vehicle body type, 2007
| Body type | Number of vehicles | Vehicle-kilometres (millions) | Passenger-kilometres (millions) |
|---|---|---|---|
| Car | 10 152 717 B | 143 876.8 A | 224 266.0 A |
| Station wagon | 302 047 B | 4 520.4 D | 7 054.9 D |
| Subtotal – Passenger vehicles | 10 454 764 A | 148 389.4 A | 231 313.1 A |
| Van | 3 064 572 C | 54 319.9 B | 104 524.3 B |
| SUV | 1 810 801 D | 37 509.4 B | 62 131.4 B |
| Pickup truck | 3 718 848 C | 60 942.3 B | 89 917.7 B |
| Other | – F | – F | – F |
| Subtotal – Light trucks | 8 548 663 B | 151 813.9 A | 255 618.6 A |
| Total – Light vehicles | 19 003 427 A | 300 203.3 A | 486 931.7 A |
The letter to the right of each estimate indicates its quality: A – Excellent, B – Very good, C – Good,
D – Acceptable, E – Use with caution and F – Too unreliable to be published.
Due to rounding, the numbers in the tables may not add up, and some data may differ slightly from one table to the next.
From 2000 to 2007, there was a significant increase of 58 percent in the number of SUVs, along with a 39 percent increase in pickup trucks and an overall increase of 14 percent in light vehicles. Surprisingly, there was only a 1 percent increase in the total number of cars.
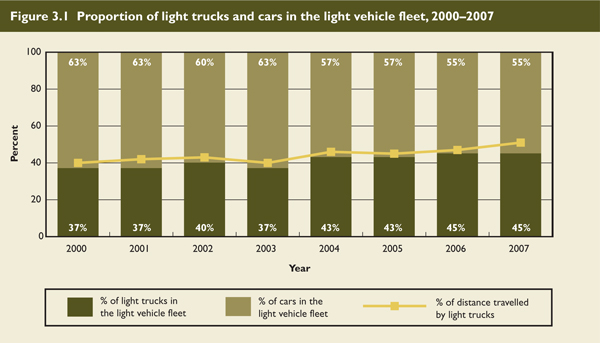
Figure 3.1 shows the increasing popularity of light trucks within the light vehicle category. In 2007, light trucks accounted for 45 percent of Canada’s light vehicle fleet – up from 37 percent in 2000. Over the same period, light trucks’ share of total distance travelled by all light vehicles increased steadily (with the exception of a slight decline in 2003). In 2007, light trucks accounted for more than half of all vehicle-kilometres travelled for the light vehicle segment.
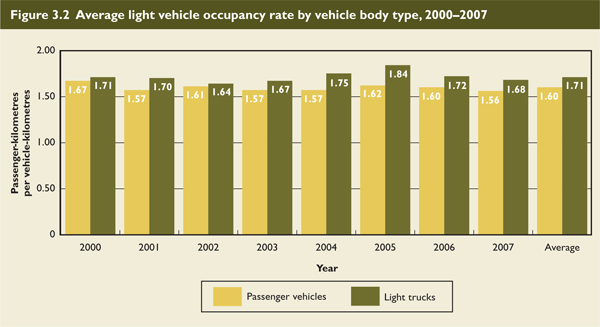
Using the data on vehicle-kilometres and passenger-kilometres travelled in Table. 3.1, the passenger-kilometres/vehicle-kilometres ratio can be determined – an indication of the average vehicle occupancy rate. That is, for every kilometre a vehicle is driven, the number of occupants can be estimated.
As shown in Figure 3.2, this ratio dropped 6.6 percent for passenger vehicles and 1.8 percent for light trucks between 2000 and 2007. These data coincide with the tendency that light trucks (such as vans and SUVs) have a higher occupant capacity than light cars. In 2005, a rising trend in light truck occupancy rate was reported, as shown in Figure 3.2. However, in 2007, the ratio was closer to the 2000 figures and to the average for the eight years.
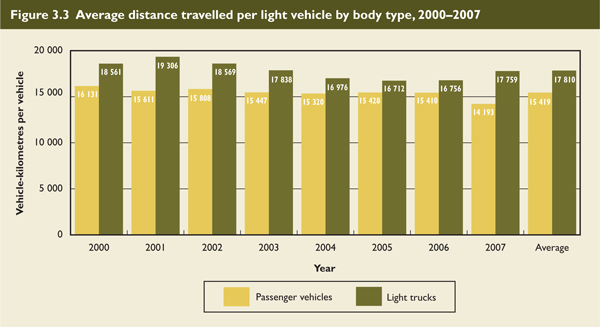
Differences emerged regarding the average number of vehicle-kilometres travelled per vehicle body type. Figure 3.3 shows that light trucks travelled more vehicle-kilometres than did passenger cars, on average.
Given current estimates of fuel consumption by vehicle body type, if Canadians’ growing interest in light trucks is confirmed or intensified in the coming years, overall total fuel consumption for the light vehicle category will increase. Table 3.2 shows total fuel consumption and the fuel consumption rate (L/100 km) by vehicle body type and fuel type for 2007.
Table 3.2 Effect of light vehicle size on fuel consumption in Canada, 2007
| Fuel consumption (millions of L) | Fuel consumption rate (L/100 km) | |||
|---|---|---|---|---|
| Body type | Gasoline | Diesel | Gasoline | Diesel |
| Car | 12 658.9 C | – F | 9.0 B | – F |
| Station wagon | – F | – F | 10.2 E | – F |
| Subtotal – Passenger vehicles | 13 109.7 C | – F | 9.0 B | – F |
| Van | 6 379.4 C | – F | 11.9 B | 14.7 E |
| SUV | 4 409.8 C | – F | 11.8 B | – F |
| Pickup truck | 7 467.7 B | 1 236.1 D | 14.3 A | 14.8 B |
| Subtotal – Light trucks | 18 195.3 B | 1 113.7 E | 12.7 A | 13.6 B |
| Total – Light vehicles | 31 305.0 B | 1 292.1 E | 10.8 A | 12.3 C |
The letter to the right of each estimate indicates its quality: A – Excellent, B – Very good, C – Good,
D – Acceptable, E – Use with caution and F – Too unreliable to be published.
Due to rounding, the numbers in the tables may not add up, and some data may differ slightly from one table to the next.
The proportion of total gasoline consumption by light trucks was 16 percent higher than that for passenger vehicles. On-road fuel consumption rates confirmed that the larger body types found in the light trucks segment were less efficient than the body types of cars and stations wagons in the passenger vehicles’ segment. The rate of fuel consumption increased with the size of the vehicle. As a result, cars and station wagons offered better fuel efficiency than light trucks, because they consumed, on average, 3.7 L of gasoline per 100 km less than light trucks. As a whole, the light vehicle category consumed gasoline at an average rate of 10.8 L/100 km in 2007.
3.2 Age of light vehicles
An important characteristic of a vehicle’s fuel efficiency is its model year or age. Newer vehicles are usually considered to be more fuel efficient. Figure 3.4 shows Canada’s light vehicle fleet in 2007 by age of vehicle.
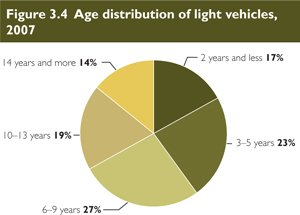
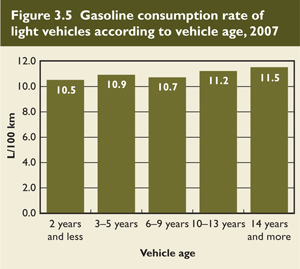
Figure 3.4 shows that two thirds of the light vehicles on Canadian roads in 2007 were less than 10 years old. Older vehicles use less advanced technologies, which may increase fuel consumption. In addition, the greater fuel consumption rate of older vehicles can be exacerbated by general wear and tear. The fuel consumption rates according to vehicle age are presented in Figure 3.5. In 2007, older vehicles did, in fact, consume gasoline at a higher rate than younger light vehicles (a difference of 10 percent).
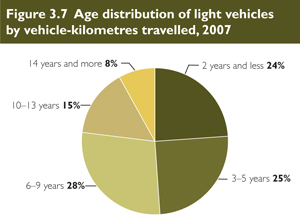
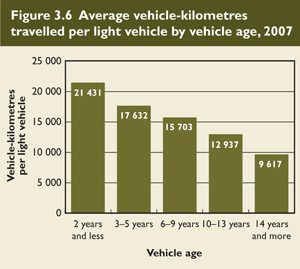
Newer vehicles, on average, travel more kilometres per year per vehicle, as shown in Figure 3.6. In fact, more than three quarters of the distance travelled in 2007 by light vehicles were by vehicles less than 10 years old. Nearly half (49 percent) of the total distance driven was by vehicles five years old and under. One possible explanation for this trend is that the older vehicles may be the secondary vehicle and therefore are not driven as frequently. Furthermore, due to Canada’s climate, older vehicles may get stored in the winter. This would especially apply to vehicles 14 years and older.
The percentages in Figure 3.7 illustrate that new vehicles, on average, travelled more vehicle-kilometres annually than older vehicles.