Natural Resources Canada
www.nrcan.gc.ca
Common menu bar links
Office of Energy Efficiency Links
Office of Energy Efficiency
Menu
Canadian Vehicle Survey 2007 Summary Report
Chapter 2. Geographic analysis
This chapter highlights regional and provincial/territorial variations in the composition and use of the vehicle fleet and in vehicle fuel efficiency.
2.1 Composition of the on-road vehicle fleet in Canada’s provinces and territories
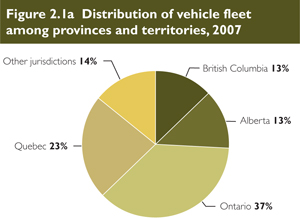
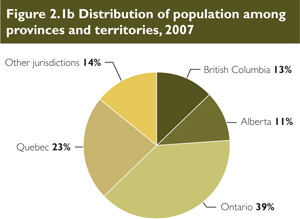
Provincial and territorial distribution of on-road vehicles in Canada shows that Ontario had the most vehicles in 2007, with 7 million vehicles. The next highest numbers were in Quebec (4.5 million) and Alberta and British Columbia (2.6 million each). These four provinces represented more than 85 percent of all vehicles in Canada. Figures 2.1a and 2.1b show the high correlation between vehicle distribution in and population of each region of the country.
Table 2.1 Number of vehicles in Canada by vehicle type and jurisdiction, 2007
| Jurisdiction | Light vehicles | Medium trucks | Heavy trucks | Total |
|---|---|---|---|---|
| Number of vehicles | ||||
| Newfoundland and Labrador | 267 464 B | 3 575 E | 2 881 E | 273 919 B |
| Prince Edward Island | 76 985 C | 1 328 E | 2 613 E | 80 926 C |
| Nova Scotia | 537 784 B | 7 517 E | 7 671 E | 552 973 B |
| New Brunswick | 462 710 B | 5 913 E | 4 036 E | 472 658 B |
| Quebec | 4 417 295 A | 46 237 E | 39 156 D | 4 502 689 A |
| Ontario | 6 957 086 A | 84 345 D | 112 902 C | 7 154 332 A |
| Manitoba | 641 456 B | 10 625 E | 16 446 E | 668 527 B |
| Saskatchewan | 676 469 B | 33 960 E | 26 533 E | 736 963 B |
| Alberta | 2 421 733 B | 106 735 D | 82 704 D | 2 611 173 B |
| British Columbia | 2 495 210 B | 89 701 E | 16 972 E | 2 601 883 B |
| Yukon | 25 423 A | 1 662 C | 1 332 C | 28 417 A |
| Northwest Territories | 21 302 A | 808 D | 1 463 B | 23 573 A |
| Nunavut | 3 123 B | 270 E | 223 E | 3 493 B |
| Total | 19 003 427 A | 392 608 B | 314 878 B | 19 710 912 A |
The letter to the right of each estimate indicates its quality: A – Excellent, B – Very good, C – Good,
D – Acceptable, E – Use with caution and F – Too unreliable to be published.
Due to rounding, the numbers in the tables may not add up, and some data may differ slightly from one table to the next.
Light vehicles represented 96 percent of the vehicles in Canada. However, in Nunavut, Northwest Territories and Yukon, light vehicles made up only 86 percent, 90 percent and 89 percent respectively of the vehicle fleet. These variations could be attributed to many factors, including terrain, weather, cost, limited road infrastructure and the use of off-road vehicles.
Medium and heavy trucks made up less than 10 percent of the remaining fleet nationally. The percentage of medium and large trucks in the on-road vehicle fleet was largest in Nunavut, Yukon, Saskatchewan and Alberta. The trucks accounted for more than 4 percent of the fleet in these four jurisdictions in 2007. Factors attributed to this include extreme weather conditions and industrial requirements.
As shown in Figure 2.2, the per capita number of vehicles was close to the Canadian average in each jurisdiction except for Nunavut, Saskatchewan, Alberta and Yukon. Moreover, the national average was less than one vehicle for every person (0.6 per capita) in 2007. Nunavut had the lowest number of vehicles, with only one vehicle per 10 inhabitants in 2007 (0.1 per capita). This low rate could be attributed to fewer roads and large distances between population centres. Weather could also play a role, e.g. long winters could mean more reliance on snowmobiles and all-terrain vehicles.

2.2 Vehicle use in Canada’s provinces and territories
The 2007 CVS reveals a strong correlation among distance travelled, fuel consumption and population demographics. The greatest distances travelled and the highest consumption of gasoline and diesel occurred in the most heavily populated regions.
Table 2.2 shows regional differences in distance travelled and fuel consumption. More than one third (37 percent) of diesel consumption in 2007 was in the Prairie provinces, although this region accounts for less than one quarter (23 percent) of the distance travelled in Canada. This consumption may be linked to the high number of vehicle-kilometres of heavy vehicles in Manitoba, Saskatchewan and Alberta (see Figures 2.4a and 2.4b). Light vehicles represented 94 percent of the vehicle-kilometres in Canada (excluding the Prairie provinces), but only 83 percent of the vehicle-kilometres travelled in the Prairie provinces. Medium and heavy trucks accounted for 17 percent of the vehicle-kilometres driven in the Prairie provinces, whereas they accounted for only 6 percent in other provinces and territories.
Table 2.2 Distance travelled and fuel consumption in the provinces and territories, 2007
| Jurisdiction | Vehicle-kilometres | Passenger-kilometres | Gasoline | Diesel | Population |
|---|---|---|---|---|---|
| (millions of km) | (millions of litres) | (thousands) | |||
| Newfoundland and Labrador | 4 362 B | 7 370 B | 421 E | 86 D | 506.3 |
| Prince Edward Island | 1 434 C | 2 319 D | 136 E | 32 E | 138.6 |
| Nova Scotia | 10 613 B | 17 908 B | 995 D | 252 D | 934.1 |
| New Brunswick | 8 114 B | 13 182 B | 786 D | 84 E | 749.8 |
| Quebec | 70 702 A | 114 622 B | 6 422 C | 1 953 B | 7 700.8 |
| Ontario | 125 287 A | 196 184 A | 12 295 C | 3 856 B | 12 803.9 |
| Manitoba | 13 840 B | 22 672 B | 1 236 D | 656 C | 1 186.7 |
| Saskatchewan | 13 448 B | 21 365 B | 1 253 D | 676 C | 996.9 |
| Alberta | 47 798 B | 71 630 B | 4 413 C | 2 736 B | 3 474.0 |
| British Columbia | 35 799 B | 57 198 B | 3 691 D | 735 D | 4 380.3 |
| Yukon | 487 B | n/a | n/a | n/a | 31.0 |
| Northwest Territories | 359 B | n/a | n/a | n/a | 42.6 |
| Nunavut | 33 D | n/a | n/a | n/a | 31.1 |
| Total | 332 276 A | 524 450 A | 31 647 B | 11 066 A | 32 976.1 |
The letter to the right of each estimate indicates its quality: A – Excellent, B – Very good, C – Good,
D – Acceptable, E – Use with caution and F – Too unreliable to be published.
Due to rounding, the numbers in the tables may not add up, and some data may differ slightly from one table to the next.
Figure 2.3 shows how many kilometres Canadians travel annually by province and territory. The Canadian average was just over 10 000 kilometres (km), with significant fluctuations witnessed in Nunavut, Yukon, Alberta and Saskatchewan. For the latter three jurisdictions, one likely explanation is that people have to drive further to do their daily activities. As for Nunavut, there are few vehicles; moreover, people tend to drive shorter distances and less frequently. The use of snow transport(e.g. snowmobiles) is more commonplace in Canada’s northern regions.


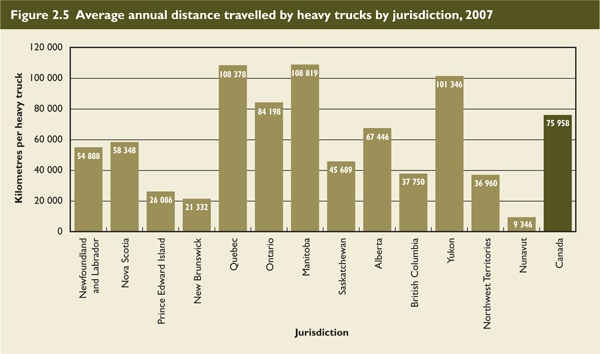
Another variable that reveals interesting provincial and territorial variations is the average distance travelled by vehicle type. While there were some minor regional differences in the use of light vehicles and medium trucks, the distance travelled per vehicle was similar in most jurisdictions. However, the average distance travelled per heavy truck varied from one jurisdiction to the next, as shown in Figure 2.5. The Canadian average of 75 958 km was exceeded in only four jurisdictions: Ontario, Manitoba, Quebec and Yukon. In Manitoba and Quebec, heavy trucks were used more intensively than in the rest of Canada, travelling an average of more than 100 000 km each year. Manitoba is ideal for heavy trucking because of its demographic centrality, insufficient rail line infrastructure5 and high trade activity between the Emerson, Manitoba, and Pembina, North Dakota, border crossing. The 2007 survey shows that the annual average distance travelled by heavy trucks was less than 40 000 km in Nunavut, New Brunswick, Prince Edward Island, Northwest Territories and British Columbia.
2.3 Provincial fuel consumption rates
Interprovincial variations also emerged in vehicle fuel efficiency. Figure 2.6 shows the gasoline fuel efficiency rates among light vehicles in the provinces in 2007. The average fuel consumption rate by light vehicles in Canada for 2007 was 10.9 L/100 km.
The findings presented in Figure 2.6 show that the three provinces with the highest fuel consumption rates are in western Canada. Fuel efficiency rates for light vehicles were fairly consistent among the other provinces and were slightly better than the Canadian average for all types of vehicles (10.9 L/100 km). The regional differences highlighted in Figure 2.6 can be related to the composition of the vehicle fleet (sport utility vehicles [SUVs], pickup trucks, vans, etc.), which differed from one province to the next. For example, as shown in Figure 2.7, the percentage of light trucks – vans, SUVs and pickup trucks – in the light vehicle fleet was higher in the western provinces than in the rest of the provinces. Chapter 3 of this report examines the relationship between the class and age of a vehicle and its fuel efficiency. Estimates also showed that a large percentage of light vehicles in the western provinces were more than 14 years old.
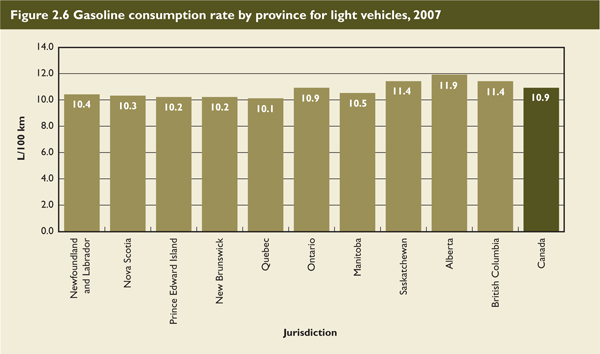
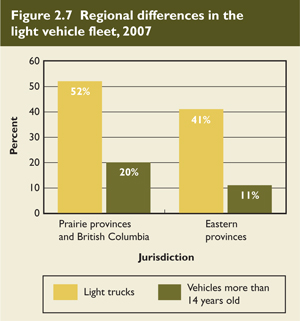
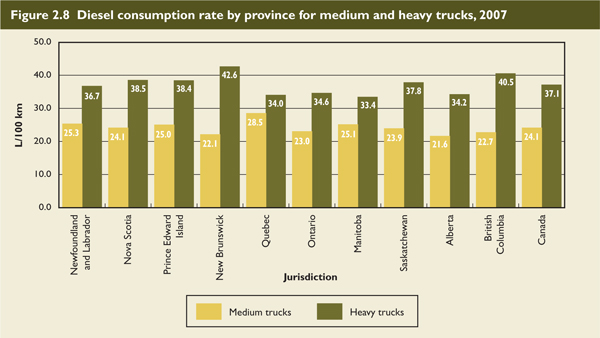
Figure 2.8 shows diesel fuel consumption rates for medium and heavy trucks. It is also interesting that the fuel consumption rates for heavy trucks were slightly lower than the Canadian average in Quebec, Ontario and Manitoba – the three provinces where they were driven most extensively, as shown in Figures 2.4a and 2.4b (on page 17). British Columbia, Nova Scotia and New Brunswick showed slightly higher diesel consumption rates for their heavy truck fleets.