
Natural Resources Canada
www.nrcan.gc.ca
Common menu bar links
Office of Energy Efficiency Links
Office of Energy Efficiency
Menu
Canadian Vehicle Survey 2007 Summary Report
Annex A. Note on data quality and interpretation of results
The Canadian Vehicle Survey (CVS) is a quarterly vehicle-based survey. It provides quarterly and annual estimates of the distance travelled by on-road vehicles in Canada and their fuel consumption.11 In 2007, there were 26 987 vehicles in the sample from the provinces and 11 693 in the sample from the territories. Since participation is voluntary, a certain percentage of these samples included non-respondents. The response rate was about 61 percent for the provinces and 12 percent for the territories, resulting in a good response rate for the CVS compared with similar surveys conducted elsewhere in the world.
While considerable effort is exerted to ensure that high standards are maintained throughout all survey operations, the resulting estimates are inevitably subject to a certain degree of error. The total survey error is defined as the difference between the survey estimate and the true value for the population. The total survey error consists of two types of errors: sampling and non-sampling.
Sampling errors occur because the CVS studies only a segment of the population, rather than the entire population, as in a census. Factors such as sample size, sample design and estimation method affect the sampling error. If the population is heterogeneous, as is the case for the CVS, a large sample size is needed to reduce sampling errors. In addition, the CVS relies on a stratified sample design to divide the population into similar groups, thereby reducing sampling errors by producing estimates for homogeneous groups. These estimates are then aggregated to produce estimates for the entire population. Each estimate in the report is associated with a coefficient of variation (CV), which is the basis for determining an all-encompassing quality indicator. CVs measure the sampling error of the estimates and take into account variability due to non-response and imputation.
CVs are also used to establish confidence intervals (I), which express the accuracy of an estimate in concrete terms. The (I) indicates the level of confidence according to which the true value of a characteristic of the population under study occurs within certain limits. For example, an (I) of 95 percent, (I)(0.95), implies that if the sampling were repeated indefinitely, with each sample providing a different (I), 95 percent of the intervals would contain the true value.12
To illustrate how all of these concepts are linked, take as an example a CVS estimate stating that on-road vehicles travelled 332.3 billion vehicle-kilometres in Canada in 2007. This is an excellent estimate because it has a CV of 0.026 and, therefore, a quality indicator of “A.” To determine the (I) of 95 percent attributed to this estimate, the following calculation is performed:13
(I)(0.95) = [332.3 billion x (1 – 1.96 x CV),
332.3 billion x (1 + 1.96 x CV)]
(I)(0.95) = [332.3 billion x (1 – 1.96 x 0.026),
332.3 billion x (1 + 1.96 x 0.026)]
(I)(0.95) = [315.3 billion, 349.2 billion]
Based on this (I), it can be stated with a 95 percent degree of confidence that the distance travelled in Canada in 2007 was between 315.3 billion and 349.2 billion vehicle-kilometres. The smaller the (I), the greater the chances that the survey estimate is close to the true value. Figure A-1 shows the (I) for the preceding example. It is important to remember the confidence interval when analysing survey results.
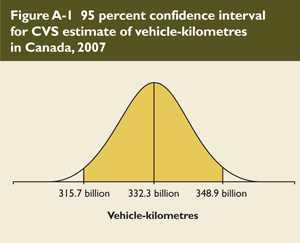
Table A-1 is a reference for readers who want to assess the (I) attributed to an estimate based on the quality indicators in this report. Note that the report uses stringent standards identified by Statistics Canada for determining whether an estimate is “excellent” or “very good.”
Table 4.2 Table A-1 Range of the confidence intervals attributed to CVS estimates
| Quality indicator | Quality of estimate |
Coefficient of variation | Range of the confidence intervals |
|---|---|---|---|
| A | Excellent | Less than 5.0% | Estimate ± 0.0% to 9.9% |
| B | Very good | 5.0% – 9.9% | Estimate ± 10.0% to 19.9% |
| C | Good | 10.0% – 14.9% | Estimate ± 20.0% to 29.9% |
| D | Acceptable | 15.0% – 19.9% | Estimate ± 30.0% to 39.9% |
| E | Use with caution | 20.0% – 34.9% | Estimate ± 40.0% to 69.9% |
| F | Too unreliable to be published | 35.0% or more | Estimate ± 70.0% and over |
Non-sampling errors can also contribute to the total survey error. This second type of error can occur at almost any stage of the survey. In particular, errors can arise when a respondent provides incorrect information, does not answer a question or misinterprets a question. Non-sampling errors can also arise when data are being processed. Some of these errors will be cancelled over a large number of observations, but systematically occurring errors will contribute to a bias in the estimates. For example, if people demonstrating similar characteristics consistently tend not to respond to the survey, a bias may result in the estimates.
Some non-sampling errors are difficult to quantify and are not reflected by quality indicators. However, the CVS quality indicators take into account variance due to non-response and imputation and, as such, account for some of the non-sampling errors. Other measures, such as survey response rate and imputation rate, can also serve as indicators for non-sampling errors.
11 Annex B provides more information on the scope and methodology of the CVS.
12 Satin, A. and W. Shastry, Statistics Canada. Survey Sampling: A Non-mathematical Guide, 2nd edition, Catalogue No. 12-602E. Ottawa, 1993, p. 14.
13 If a normal distribution is assumed, the (I) of 95 percent corresponds with the estimate plus or minus about two times the standard error. The standard error is equal to the square root of the variance, which corresponds to the product of the estimate and the CV.