Survey of Household Energy Use, 2019

The Survey of Household Energy Use (SHEU) is a joint project between Statistics Canada and Natural Resources Canada (NRCan). It collects data on the energy use characteristics of private dwellings in Canada and on household use of energy resources. This report provides highlights from the survey and insights on household energy use and energy efficiencies.
The SHEU gathers information on energy use and factors affecting energy use in households, which assists in the delivery of programs to support Canadians as they seek to achieve greater energy efficiency and reduce their greenhouse gas (GHG) footprint. In 2019, about 15 million Canadian households consumed 1.5 billion gigajoules (GJ) of energy to power activities inside the home, with the average Canadian household consuming just under 100 gigajoules of energy. This is a decrease of about 1.5% from the 2015 SHEU, demonstrating that energy efficiency has helped curb energy use increase arising from higher activity levels, more appliances, and slightly colder temperatures in the home.
Household
Energy Use
Household Energy Use in 2019
- Canadians used more than 1.5 billion GJ of energy, an increase of approximately 56 million GJ from 2015. Ontario was the most energy-consuming province with 554.7 million GJ (38%) of energy use, an increase of just over 5 million GJ from 2015.
- The Atlantic provinces consumed the least amount of energy with only 87.2 million GJ (6%). This was a decrease of almost 22 million GJ from 2015.
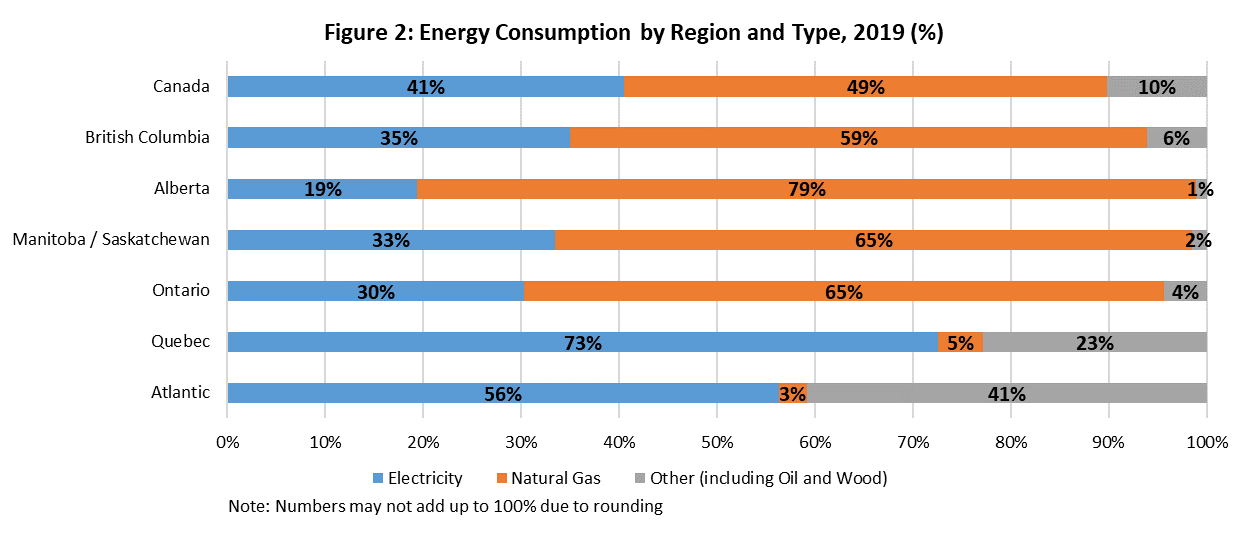
- Natural gas was the most consumed fuel in Canada with 723.9 million GJ (49%), followed by electricity with 594.9 million GJ (41%), and oil/wood with 149 million GJ (10%).
- Quebec was the largest consumer of electricity (236.5 million GJ, 40%).
- Ontario consumed the most natural gas with 362.7 million GJ (50%). Meanwhile, the Atlantic provinces utilized the least amount of natural gas, using 2.5 million GJ (0.3%).
- Quebec was also the largest consumer of oil and wood with 74.3 million GJ (50%) used.

Text version
Figure 1: Energy consumption by region, 2019
| Region | Energy consumption (%) | Number of households (million) |
|---|---|---|
| Atlantic | 6 | 1.0 |
| Quebec | 22 | 3.7 |
| Ontario | 38 | 5.6 |
| Manitoba/Saskatchewan | 8 | 1.0 |
| Alberta | 14 | 1.6 |
| British Columbia | 12 | 2.0 |
Text version
Figure 2: Energy consumption by region and type, 2019 (%)
| Region | Electricity | Natural Gas | Other (including Oil and Wood) |
|---|---|---|---|
| Canada | 41 | 49 | 10 |
| British Columbia | 35 | 59 | 6 |
| Alberta | 19 | 79 | 1 |
| Manitoba/Saskatchewan | 33 | 65 | 2 |
| Ontario | 30 | 65 | 4 |
| Quebec | 73 | 5 | 23 |
| Atlantic | 56 | 3 | 41 |
Household
Characteristics
General Characteristics of Canadian Households
- There were about 15 million households in Canada, an increase of 0.8 million homes from 2015. The most households are in Ontario (5.6 million), whereas Manitoba/Saskatchewan had the least (950 thousand).
- Single detached homes were the most common type of dwelling in Canada and mobile homes were the least common.
- Two-member households were the most common (35%), followed by one-member households (31%).
- Households with only seniors (aged 65 or over) was the most common age demographic (20%).
- The average heated area per household was 177.7 m2, a decrease from 194.8 m2 in 2015. Alberta continued to have the largest average heated area with 188.3 m2, whereas Quebec had the smallest with 158.1 m2.

Text version
Figure 3: Distribution of Dwellings by Type, 2019 (%)
| Type of Dwelling | Percent |
|---|---|
| Single detached house | 60 |
| Double / Row or Terrace / Duplex | 13 |
| Low-rise apartment | 12 |
| High-rise apartment | 10 |
| Mobile home | 1 |
| Don’t know/Not stated | 4 |
Text version
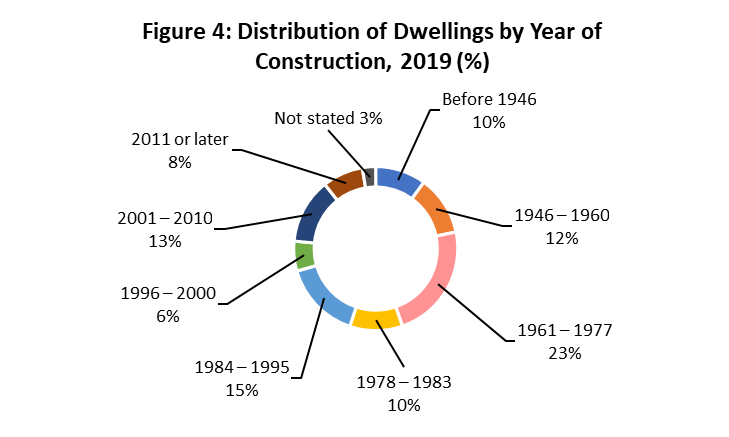
Figure 4: Distribution of Dwellings by Year of Construction, 2019 (%)
| Year of Construction | Percent |
|---|---|
| Before 1946 | 10 |
| 1946 – 1960 | 12 |
| 1961 – 1977 | 23 |
| 1978 – 1983 | 10 |
| 1984 – 1995 | 15 |
| 1996 – 2000 | 6 |
| 2001 – 2010 | 13 |
| 2011 or later | 8 |
| Not stated | 3 |
Energy
Intensity
Energy Intensity
- Alberta had the highest energy intensity, with 124.8 gigajoules per household (GJ per household), while the Atlantic provinces had the lowest with 85.2 GJ per household. The national average was 98.1 GJ per household, a decrease from 99.6 GJ per household back in 2015.
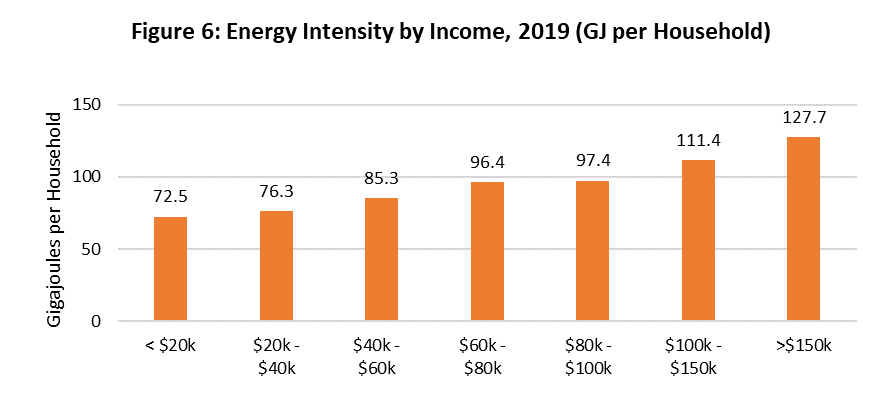
- In Canada, household income is positively correlated with energy intensity.
- By dwelling type, single detached homes had the highest energy intensity, with 122.8 GJ per household, whereas high-rise apartments had the least energy intensity (39.3 GJ per household).
- The average energy intensity for electricity in Canada was 39.8 GJ per household.
- Quebec households consumed the most electricity, with 63.9 GJ per household; more than double the consumption in Alberta (24.2 GJ per household) and Ontario (29.8 GJ per household).
- Canadians that own their homes had higher energy intensity (112.3 GJ per household) compared to those that rented (55.4 GJ per household).

Text version
Figure 5: Energy Intensity by Region, 2019 (GJ per Household)
| Region | Energy Intensity (GJ per Household) |
|---|---|
| Canada | 98.1 |
| Atlantic | 85.2 |
| Quebec | 88.1 |
| Ontario | 98.3 |
| Manitoba/Saskatchewan | 119.3 |
| Alberta | 124.8 |
| British Columbia | 91.2 |
Text version
Figure 6: Energy Intensity by Income, 2019 (GJ per Household)
| Income Level | Energy Intensity (GJ per Household) |
|---|---|
| <$20k | 72.5 |
| $20k – $40k | 76.3 |
| $40k – $60k | 85.3 |
| $60k – $80k | 96.4 |
| $80k – $100k | 97.4 |
| $100k – $150k | 111.4 |
| >$150k | 127.7 |
Energy Intensity by Heated Area
- In Canada, the average energy consumption per heated square metre was 0.55 GJ/m2, an increase from 0.51 GJ/m2 in 2015.
- Manitoba/Saskatchewan had the highest energy intensity per heated square metre with 0.67 GJ/m2, while the least energy intensive provinces were the Atlantic with 0.47 GJ/m2.
- Renters consumed more energy per heated area (0.58 GJ/m2) than owners did (0.55 GJ/m2).
Household
Improvements
Major Household Improvements
- Approximately 1.5 million Canadian households conducted an energy audit within the last 10 years, with 95% of those households making energy efficient changes as a result.
- Since the beginning of 2015, more than 6.1 million households made improvements that reduce energy consumption.
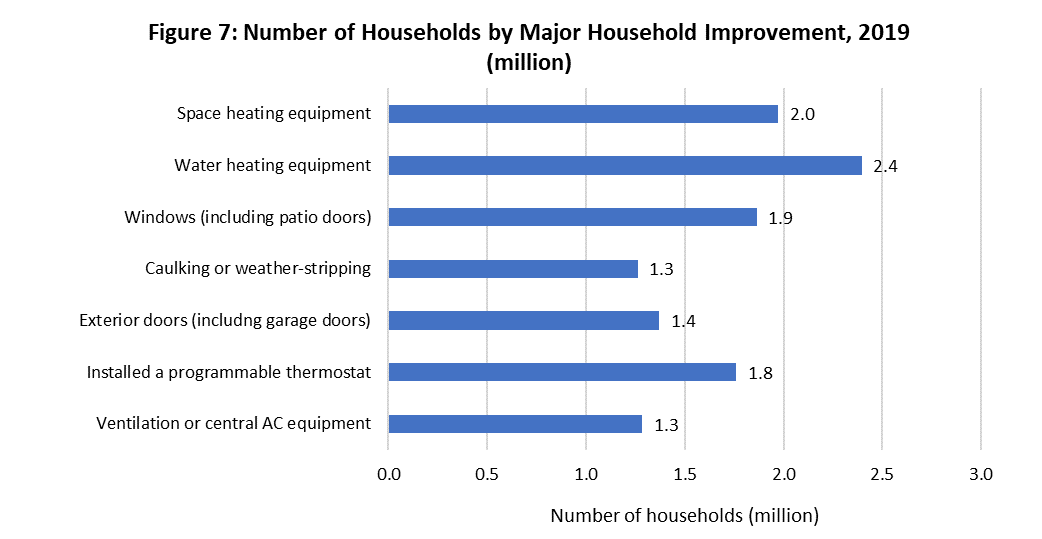
- The most common type of improvement made to a dwelling was with water heating equipment, followed by space heating equipment and windows.
- Approximately 934 thousand households received a government grant as part of a home energy retrofit program.
Text version
Figure 7: Number of Households by Major Household Improvement, 2019 (million)
| Major Household Improvement | Number of Households (million) |
|---|---|
| Space heating equipment | 2.0 |
| Water heating equipment | 2.4 |
| Windows (including patio doors) | 1.9 |
| Caulking or weather-stripping | 1.3 |
| Exterior doors (includng garage doors) | 1.4 |
| Installed a programmable thermostat | 1.8 |
| Ventilation or central AC equipment | 1.3 |
Heating
Systems
Heating Systems
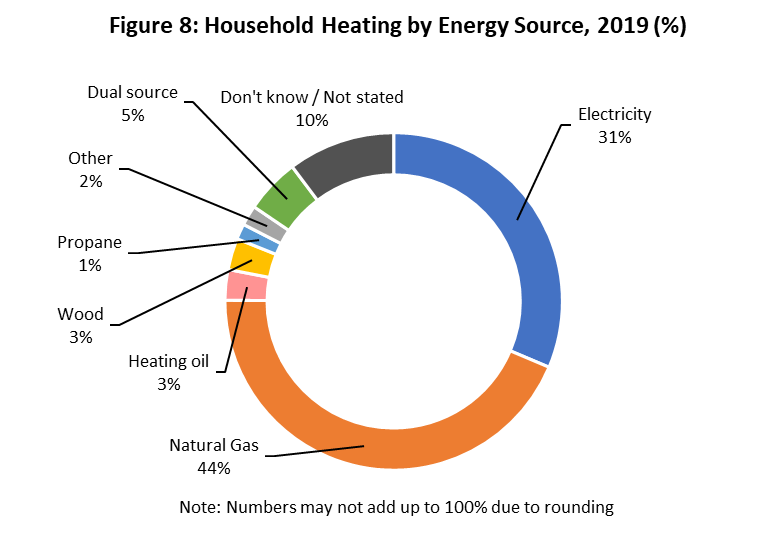
- The most common main energy source for heating was natural gas (44%), followed by electricity (31%) and wood (3%).
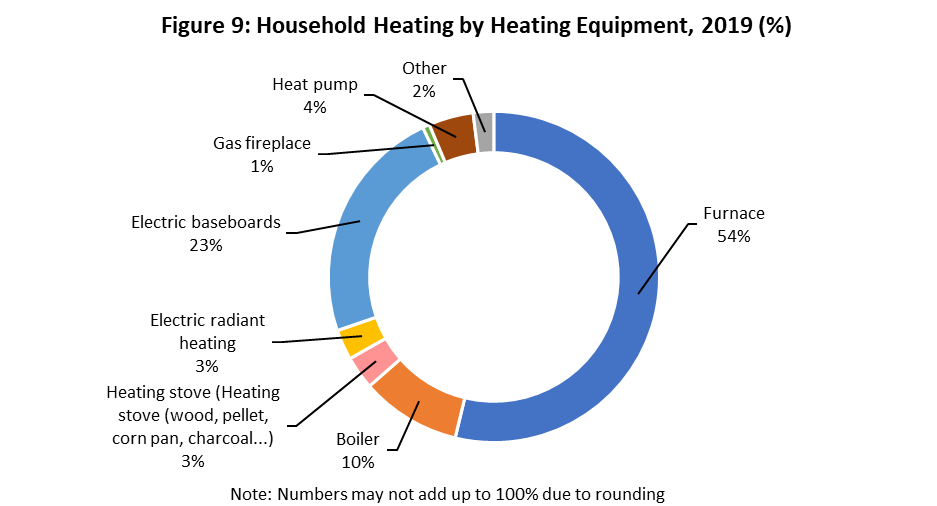
- Furnaces were the most common type of main heating equipment, with 54% of Canadian households using this equipment.
- Almost 6.7 million households (45%) have a supplemental heating system. Among these, gas fireplaces are the most common.
- When present and awake, Canadian households preferred to have their dwelling temperature between 20°C and 22°C.
- In general, Canadian households preferred to have their dwelling around the same temperature or lower when they were awake compared to asleep.
Text version
Figure 8: Household Heating by Energy Source, 2019 (%)
| Main Energy Source | Percent |
|---|---|
| Electricity | 31 |
| Natural Gas | 44 |
| Heating Oil | 3 |
| Wood | 3 |
| Propane | 1 |
| Other | 2 |
| Dual Source | 5 |
| Don’t know / Not stated | 10 |
Text version
Figure 9: Household Heating by Heating Equipment, 2019 (%)
| Main Heating Equipment | Percent |
|---|---|
| Furnace | 54 |
| Boiler | 10 |
| Heating stove (wood, pellet, corn pan, charcoal…) | 3 |
| Electric radiant heating | 3 |
| Electric baseboards | 23 |
| Gas fireplace | 1 |
| Heat pump | 4 |
| Other | 2 |
Appliances
Appliances
- Almost 4.7 million households have a second refrigerator, and about 465 thousand have three or more.
- Electricity was still the most common energy source for cooking appliances, with more than 7.3 million households.
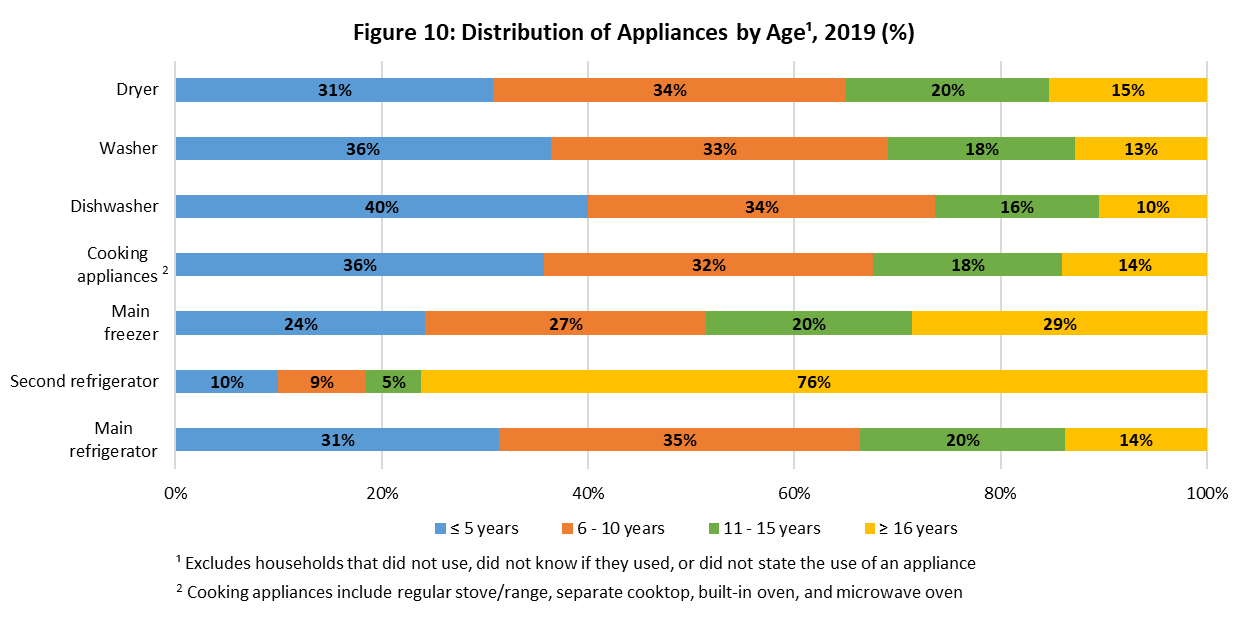
- The majority of household appliances, including refrigerators, freezers, cooking appliances, dishwashers, clothes washers, and dryers, are 10 years old or less.
Text version
Figure 10: Distribution of Appliances by Age Footnote 1 , 2019 (%)
| Appliance | Age (years) | |||
|---|---|---|---|---|
| ≤ 5 | 6 – 10 | 11 – 15 | ≥ 16 | |
| Main refrigerator | 31 | 35 | 20 | 14 |
| Second refrigerator | 10 | 9 | 5 | 76 |
| Main freezer | 24 | 27 | 20 | 29 |
| Cooking appliances Footnote 2 | 36 | 32 | 18 | 14 |
| Dishwasher | 40 | 34 | 16 | 10 |
| Washer | 36 | 33 | 18 | 13 |
| Dryer | 31 | 34 | 20 | 15 |
Electronic
Devices
Electronic Devices
- Televisions (14.6 million households), computers/tablets (13.8 million households), and cellphones (13.7 million households) were the most popular electronic devices. Meanwhile, smart home devices were the least popular, with only 3.2 million households using this type of device.
- The average use of most electronic devices in a week was less than or equal to four hours. However, cellphones and network devices were typically always turned on.

Text version
Figure 11: Use of the most frequent electronic devices in an average week Footnote 1 , 2019 (%)
| Device | Usage (hours) | ||||
|---|---|---|---|---|---|
| ≤ 4 | 5 – 10 | 11 – 20 | ≥ 21 | Always turned on | |
| Television | 19 | 23 | 15 | 42 | 1 |
| Devices used with a TV | 37 | 19 | 11 | 29 | 4 |
| Cellphone | 22 | 13 | 9 | 16 | 40 |
| Computer / Tablet | 25 | 20 | 13 | 33 | 9 |
| Network device | 10 | 8 | 6 | 14 | 62 |
Lighting
Lighting
- Light-emitting diodes (LED) were the most used lightbulbs across Canada, with almost 9.9 million households using them, followed closely by incandescent with 9.7 million households.
- The number of households using LEDs increased by 68% since 2015 (5.9 million households).
- The average number of hours of use increases during the winter compared to the summer.

Text version
Figure 12: Lightbulb Usage by Type, 2019 (%)
| Type of Lightbulb | Percent |
|---|---|
| Incandescent | 65 |
| Compact fluorescent | 44 |
| Halogen | 47 |
| Other fluroescent | 43 |
| LED | 66 |
| Other | 11 |
Electric
Vehicles
Electric Vehicles
- There are approximately 655 thousand households (4%) that own an electric or hybrid vehicle in Canada.
- Household income is positively correlated with owning an electric or hybrid vehicle.