Natural Resources Canada
www.nrcan.gc.ca
Common menu bar links
Office of Energy Efficiency Links
Office of Energy Efficiency
Menu
Consumption of Energy Survey for Universities, Colleges and Hospitals, 2003
PDF Version | Table of Contents | Next Page
C. HOSPITALS
The hospital complex survey population was extracted from the Business Register using the following NAICS codes: 622111 General (except paediatric) Hospitals; 622210 Psychiatric and Substance Abuse Hospitals; and 622112 Paediatric Hospitals. Only complexes with 50 or more employees were surveyed in order to exclude associations and entities that may have the NAICS code of a hospital but not the same mandate or mission (e.g. a Board of Directors). The survey covered 729 hospital complexes in Canada. Viewed regionally, the Consumption of Energy Survey (CES) covered 82 complexes in the Atlantic region, 162 in Quebec, 199 in Ontario, 196 in the Prairies, and 90 in British Columbia and the Territories.
Table 5 shows a breakdown of the hospital energy consumption data by region.
| Region | Atlantic | Quebec | Ontario |
|---|---|---|---|
| Electricity | 1 779 243A | 3 618 627A | 4 956 529A |
| Natural gas | 280 330B | 4 711 555A | 7 893 639A |
| Heavy fuel oil | 1 761 312B | 1 184 487A | 53 535B |
| Diesel | 27 309C | 43 684B | 596 897C |
| Other middle distillates | 1 125 024A | 606 112A | 196 957A |
| Propane | 6 009B | 13 784A | 69 475D |
| Steam | 294 382B | 229 340C | 1 006 635B |
| Wood | 533 122B | 372 436B | x |
| Total | 5 806 733A | 10 780 026A | 14 773 667A |
| Region | Prairies | British Columbia/ Territories |
Total |
|---|---|---|---|
| Electricity | 3 814 809A | 1 711 813B | 15 881 021A |
| Natural gas | 9 116 222A | 3 183 718C | 25 185 464A |
| Heavy fuel oil | x | F | 3 035 683A |
| Diesel | F | F | 1 943 154D |
| Other middle distillates | F | F | 2 139 916A |
| Propane | 86 153C | 138 927D | 313 349B |
| Steam | 747 752C | F | 2 357 590A |
| Wood | x | x | 905 559A |
| Total | 15 156 774A | 5 245 535B | 51 762 735A |
The letter to the right of each estimate indicates its quality, as follows: A – excellent, B – good, C – acceptable, D – use with caution, F – too unreliable to be published, and x – not reported in compliance with the confidentiality provisions of the Statistics Act.
In 2003, hospitals consumed nearly 52 million GJ, an amount equal to the average annual consumption of approximately 450 000 Canadian households, or all the private dwellings of a metropolitan census area the size of Ottawa-Gatineau.
Natural gas accounted for 49 percent of the total energy use of Canadian hospitals, followed by electricity at 31 percent and heavy fuel oil at 6 percent. Regionally, natural gas accounted for nearly 60 percent of hospital energy use in the Prairies and in British Columbia and the Territories, 55 percent in Ontario, and 44 percent in Quebec. Heavy fuel oil accounted for 30 percent of hospital energy use in the Atlantic region, with electricity accounting for an almost identical percentage.
Energy Intensity
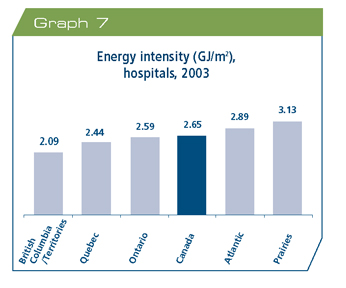
The average energy intensity of hospitals in Canada was 2.65 GJ/m². This was the highest ratio among the three sectors covered by the survey. As was observed for colleges and universities, the gap between the gross ratios among the three sectors stems from their dissimilar vocations. The high energy intensity of hospitals is probably due to their nearly constant use of numerous types of medical equipment as well as lighting.
Graph 7 shows, for each region, the energy intensity of hospitals expressed in gigajoules per square metre. Hospitals in British Columbia and the Territories were the least energy intensive, with a ratio of 2.09 GJ/m². Quebec and Ontario also ranked below the average for all Canadian hospitals, with ratios of 2.44 GJ/m² and 2.59 GJ/m², respectively. The Atlantic region (2.89 GJ/m²) and the Prairies (3.13 GJ/m²) were the most energy intensive.
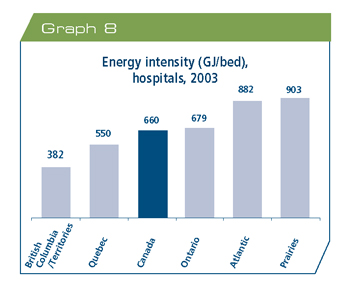
If energy intensity is expressed in gigajoules per available hospital bed, the regions follow the same ranking, but the gaps between their ratios are larger. Graph 8 shows the energy intensity of hospitals in gigajoules per bed. The average energy intensity for all Canadian hospitals is 660 GJ per bed. The region of British Columbia and the Territories shows the lowest energy intensity, with consumption at 382 GJ/bed, followed by Quebec, with 550 GJ/bed, and Ontario, with 679 GJ/bed. The Atlantic region and the Prairies have much higher energy intensities, with ratios of 882 GJ/bed and 903 GJ/bed respectively.
Greenhouse Gas Emissions
By applying the emissions factors set by Environment Canada to the CES data, the GHG emissions of hospitals in Canada can be calculated. Table 6 shows, for each region, the hospitals' GHG emissions associated with their three main energy sources, namely natural gas, electricity and heavy fuel oil. In 2003, the energy consumption of hospitals produced nearly 2.8 million tonnes of GHGs, which is equivalent to the average annual emissions of approximately 814 000 compact cars or 533 000 sport utility vehicles.
| Region | Natural gas | Electricity | Other middle distillates | Total (all energy sources) |
|---|---|---|---|---|
| Atlantic | 14B | 109A | 129B | 346A |
| Quebec | 235A | 221A | 87A | 598A |
| Ontario | 394B | 303A | 4B | 764A |
| Prairies | 455A | 233A | x | 796A |
| British Columbia / Territories | 159C | 105B | F | 282B |
| Total | 1 258A | 970A | 222A | 2 786A |
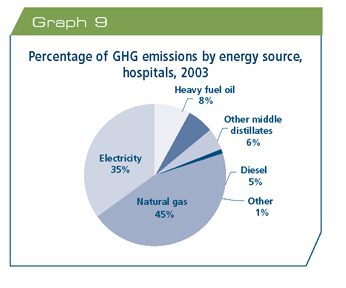
The use of natural gas accounted for 45 percent of the hospitals' GHG emissions, compared with 35 percent for electricity and 8 percent for heavy fuel oil. Regionally, the hospitals in the Prairies produced 29 percent of Canadian hospital emissions, even though they accounted for only 14 percent of the hospital complexes surveyed. Ontario hospitals produced 27 percent of the GHGs, compared with 21 percent for Quebec, 12 percent for the Atlantic region, and 10 percent for British Columbia and the Territories.
Graph 9 shows the percentage of GHG emissions attributed to each of the energy sources used by the hospitals. The use of natural gas accounts for 45 percent of the hospitals' GHG emissions, compared with 35 percent for electricity, 8 percent for heavy fuel oil and 6 percent for other middle distillates. Regionally, the use of natural gas was the main source of emissions for the Prairies (57 percent of all hospital GHG emissions), British Columbia and the Territories (56 percent), Ontario (52 percent) and Quebec (39 percent). Heavy fuel oil was the main source of the GHG emissions of hospitals in the Atlantic region, accounting for 37 percent of total emissions.