
Natural Resources Canada
www.nrcan.gc.ca
Common menu bar links
Office of Energy Efficiency Links
Business: Industrial
Menu
Improving Energy Performance in Canada – Report to Parliament Under the Energy Efficiency Act For the Fiscal Year 2007-2008
PDF Version | Table of Contents | Next Page
Chapter 1: Trends in Energy Use
Introduction
Canadians enjoy an abundance of energy from a variety of sources. This comparative advantage in the supply of energy helps Canadians deal with the economic disadvantages of small domestic markets, long distances, rugged geography and a relatively harsh climate. It also fosters the development of industries with a particularly strong energy demand.
Canadians spent about $152 billion in 2005 on energy to heat and cool their homes and offices and to operate their appliances, vehicles and industrial processes. This amount represented 14 percent of the country’s gross domestic product (GDP).²
Energy Use and Greenhouse Gas Emissions
Energy use is of two general types: primary and secondary. Primary energy use encompasses the total requirements for all users of energy, the energy required to transform one energy form to another (e.g. coal to electricity) and the energy used to bring energy supplies to the consumer. Secondary energy use is energy used by final consumers for residential, commercial/institutional, industrial, transportation and agricultural purposes.
Primary energy use represents the total requirements for all users of energy, including secondary energy use. In Canada, the increase in primary energy use reflects changes over several decades in energy-consuming equipment and buildings and in the behaviour of energy users. Primary energy use increased by 27 percent between 1990 and 2005, from 9740 petajoules3 (PJ) to 12 369 PJ.
Secondary energy use accounted for 69 percent of primary energy use in 2005, or 8475 PJ. It was responsible for 66 percent (495 megatonnes [Mt]) of total greenhouse gas (GHG) emissions in Canada, including indirect emissions – those produced by electric utilities to meet end-use electrical demand.
From 1990 to 2005, secondary energy use increased by 22 percent. At the same time, the Canadian population grew by 17 percent, and DACs increased 51 percent. Thus energy use grew less rapidly than the economy but more rapidly than the population.
As demonstrated in Figure 1-1, the industrial sector was the largest energy user, accounting for 38 percent of total secondary energy use in 2005. The transportation sector was the second largest energy user at 29.5 percent, followed by the residential sector at 16.5 percent, the commercial/institutional sector at 14 percent and the agricultural sector at 2 percent.
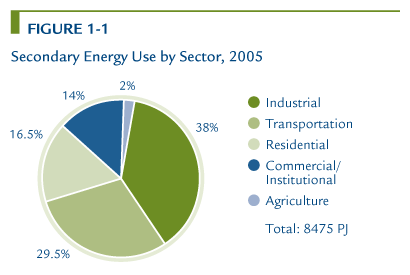
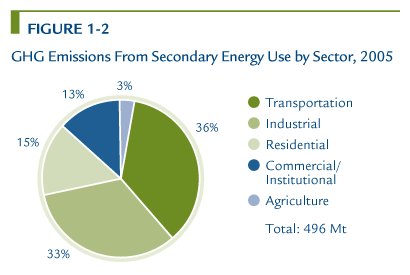
Figure 1-2 illustrates the distribution of GHG emissions by sector. This report deals with energy-related GHG emissions, which comprise carbon dioxide (CO2), methane and nitrous oxide. CO2 accounts for most of Canada’s GHG emissions. All subsequent references in this report to CO2 and GHGs include emissions that are attributable directly to secondary energy use and emissions that are attributable indirectly to electricity generation, unless otherwise specified.
Energy Intensity and Energy Efficiency
The term “energy intensity” refers to the amount of energy use per unit of activity. Energy intensity is sometimes used as a proxy for energy efficiency because it is a simple calculation for which data are readily available. However, this measure can be misleading because, in addition to pure energy efficiency, intensity captures the impact of other factors that influence energy demand, such as weather variations and changes in the structure of the economy.
Energy efficiency refers to how effectively energy is being used for a given purpose. For example, providing a similar (or better) level of service with less energy consumption on a per-unit basis is considered an improvement in energy efficiency.
To properly gauge changes in energy efficiency over time, differences in economic structure and weather need to be normalized or factored out of the intensity calculation. Natural Resources Canada’s (NRCan’s) Office of Energy Efficiency (OEE) applies an internationally recognized factorization analysis technique – the Log-Mean Divisia Index l Methodology – to isolate the impact of energy efficiency on changes in Canadian energy use.
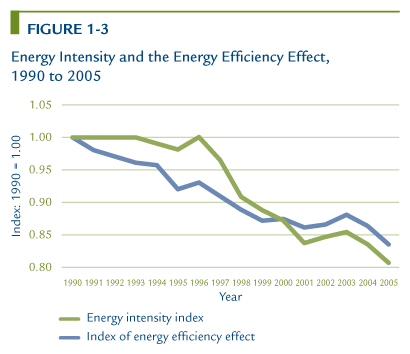
Figure 1-3 compares, for Canada, an index of annual variation in energy intensity with the OEE’s index of changes in energy efficiency over 1990 to 2005. As illustrated, Canada’s energy intensity and efficiency improved over this period. The reduction in energy intensity reflects an overall improvement in energy efficiency or how effectively energy is being used in producing one unit of DACs. At the same time, the improvement in energy efficiency indicates how effectively energy is being used to provide a certain level of service or output.
Trends in Energy Efficiency
NRCan regularly publishes Energy Efficiency Trends in Canada, which reports on changes in energy use and GHG emissions and the contributions of the following key factors to these changes (see Table 1-1):
- Increases in sector activity lead to increased energy use and emissions. In the residential sector, for example, an increase in the number of households results in increased energy use.
- Fluctuations in weather lead to changes in space-heating and space-cooling requirements. A colder winter or a warmer summer can lead to increased energy use.
- A shift in the structure of activity toward more energy-intensive components of activity leads to increased energy use and emissions. For example, if the distribution of activity in the industrial sector shifts from forestry to the iron and steel industry, industrial energy use will increase because the former sector is less energy intensive than the latter.
- Service level refers to the penetration rate of electrical devices and equipment, e.g. the use of auxiliary equipment in commercial/institutional buildings and appliances in homes or the amount of floor space cooled.
- Energy efficiency effect indicates how effectively energy is being used, i.e. the degree to which less energy is being used to provide the same level of energy service. Energy efficiency gains occur primarily with improvements in technology or processes. An example of such an improvement would be replacing incandescent lights with compact fluorescent lamps.
TABLE 1-1
Explanation of Changes in Secondary Energy Use, 1990 to 2005
| Sectors | |||||||
|---|---|---|---|---|---|---|---|
| Residential | Commercial/ Institutional |
Industrial | Transportation | Total* | Change (%) |
||
| 1990 energy use (PJ) | 1286.2 | 867.0 | 2721.8 | 1877.9 | 6952.1 | ||
| 2005 energy use (PJ) | 1402.2 | 1153.0 | 3209.4 | 2501.8 | 8475.1 | ||
| Change in energy use (PJ) |
115.9 | 286.0 | 487.6 | 624.0 | 1523.0 | 21.9 | |
| Explanatory factor (change due to) | |||||||
| Activity | 353.1 | 246.6 | 1166.0 | 750.4 | 2516.1 | 36.2 | |
| Weather | 5.5 | 25.2 | n/a | n/a | 30.8 | 0.4 | |
| Structure | 7.1 | -1.2 | -331.1 | 186.8 | -138.4 | -2.0 | |
| Service level | 71.0 | 91.8 | n/a | n/a | 162.9 | 2.3 | |
| Energy efficiency | -320.9 | -75.4 | -347.3 | -352.4 | -1096.0 | -15.8 | |
| Other factors | -1.0 | 39.2 | 47.7 | 0.7 | |||
*Total also includes energy use for agriculture.
In this report, changes in energy efficiency are the net result after allowing for changes in energy use due to activity, weather, structure and service level. However, other factors, such as individual consumer choice, may affect energy use and are not captured by the above standardized factors. The effects of activity, weather, structure and service level may overstate or understate the “actual” change in energy use and energy efficiency improvements.
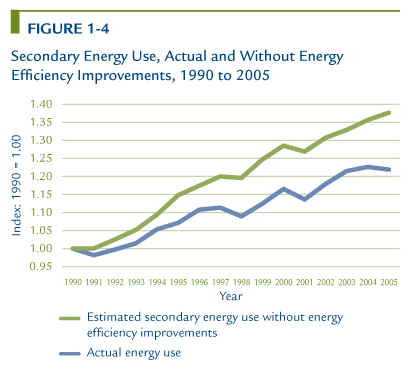
Between 1990 and 2005, secondary energy use in Canada increased from 6952 to 8475 PJ. Without improvements in energy efficiency, increases attributable to activity, weather, structure and service level would have led to an energy increase of 38 percent. However, as a result of a 16 percent (1096-PJ) improvement in energy efficiency,4 actual secondary energy use increased by only 22 percent (to 8475 PJ). This improvement in energy efficiency is estimated to have reduced GHG emissions by almost 64 Mt and decreased energy expenditures by $20.1 billion in 2005. The change in energy use between 1990 and 2005, actual and without energy efficiency improvements, is shown in Figure 1-4.
Trends in Renewable Energy
Canada is a leader in the production of renewable energy, with 16 percent of its primary energy supply coming from renewable sources in 2006. Although renewable energy is often associated with electricity, renewable energy sources also produce thermal energy (heat) and transportation fuels. Renewable energy sources in Canada include water, wind, solar, geothermal and biomass.
Canada has a significant renewable electricity supply due primarily to the widespread use of hydroelectricity. In 2005, about 60 percent of Canada’s electricity generation was provided by conventional and small hydroelectric plants, which generated more than 358 terawatt hours (TWh) of electricity, up from 337 TWh in 2004. Small hydro plants (less than 50 megawatts [MW]), with installed generating capacity of 3421 MW, provided about 2 percent of the total electricity generation in Canada.
Non-hydro renewable sources accounted for an estimated 2 percent of Canada’s total electricity generation. Biomass (waste and virgin biomass and landfill gas) is the main non-hydro renewable energy source in Canada. However, wind energy is growing rapidly, with an increase in capacity from 139 MW in 2000 to 1459 MW in 2006. Solar photovoltaic energy also experienced high rates of capacity growth – about 20 percent annually between 1993 and 2006 – although it started from a low baseline. In 2006, 20.5 MW of solar photovoltaic systems were installed in Canada, representing an increase of 3.7 MW over the previous year.
As described in Chapter 5, NRCan is carrying out two initiatives, ecoENERGY for Renewable Power and ecoENERGY for Renewable Heat, to increase the use of small-scale renewable energy in Canada.
Trends in Residential Sector
Energy Use and Greenhouse Gas Emissions
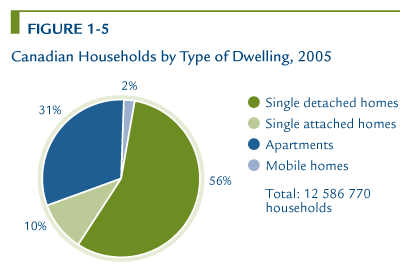
The residential sector includes four major types of dwellings: single detached, single attached, apartments and mobile homes. Energy is used in dwellings for space heating and cooling; water heating; and the operation of appliances, electronic equipment and lights. In 2005, this sector accounted for 17 percent (1402 PJ) of secondary energy use and 15 percent (73.8 Mt) of GHGs emitted in Canada.
Most dwellings in Canada are single detached houses. The next largest type of dwelling is apartments, followed by single attached dwellings and mobile homes (see Figure 1-5). The OEE’s ecoENERGY Retrofit – Homes and ecoENERGY for Buildings and Houses programs aim to improve the energy efficiency of single detached and attached houses.
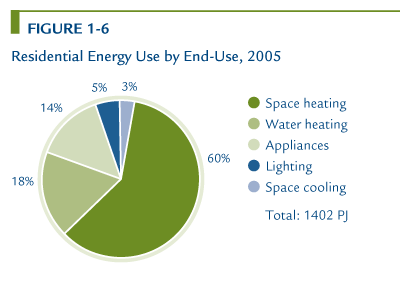
Between 1990 and 2005, residential energy use increased by 9 percent, or 116 PJ. For the same period, GHG emissions increased by 6 percent. GHG intensity decreased 14 percent despite the average household operating more appliances, becoming larger and increasing its use of space cooling. Space and water heating constituted 78 percent of residential energy use, followed by operating appliances, lighting and space cooling (see Figure 1-6).
Five main factors influenced residential energy use between 1990 and 2005 – activity, weather, structure, service level and energy efficiency effect:
- Activity – The increase in the number of households and the size of dwellings (the principal measures of residential activity) increased energy use by 28 percent (353 PJ).
- Weather – The winter in 2005 was similar to the winter in 1990 but summer temperatures were much warmer, and the result was a 0.4 percent (5.5 PJ) increase in energy use in 2005.
- Structure – The relative share of households by dwelling type (single detached, apartments, etc.) changed over the period. This change contributed to an increase in energy use of 0.6 percent (7 PJ) in 2005.
- Service level – The increased market penetration rate of appliances and increased floor space cooled by space-cooling units increased energy use by 6 percent (71 PJ).
- Energy efficiency effect – Improvements to the thermal envelope of houses and to the efficiency of residential appliances and space- and water-heating equipment led to an overall gain in energy efficiency and decreased energy use by 25 percent (321 PJ).
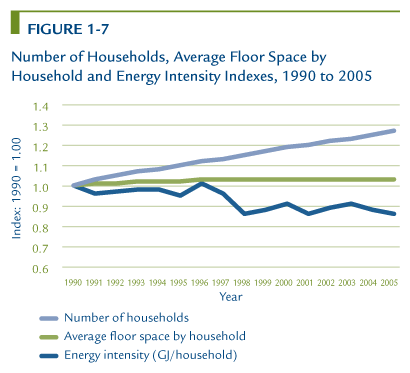
Growth in residential energy use was driven in large part by growth in activity. This growth in activity – specifically, growth in total floor space and number of households – was due to the increase in the average size of newly constructed houses, the rising population and the trend toward fewer individuals per household (see Figure 1-7).
These increases were partially offset by significant improvements in energy efficiency. Structural changes also contributed to growth in energy use, because more individuals tended to live in single detached homes and the relative share of individuals living in apartments declined. Similarly, service level increased energy demand, because more Canadians cooled their homes during the summer months in 2005 than in 1990 and Canadians operated more appliances in 2005 than they did in 1990.
Energy Efficiency
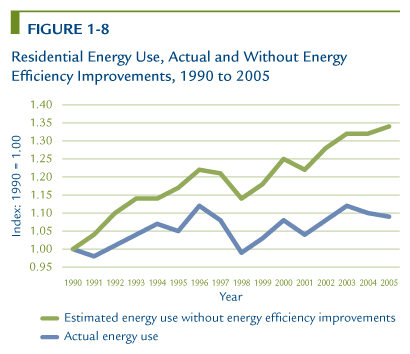
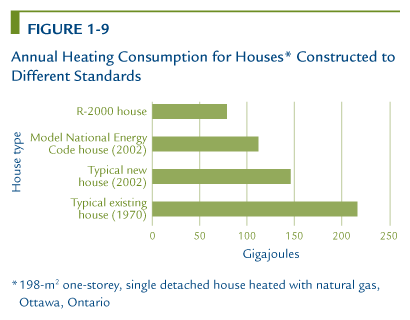
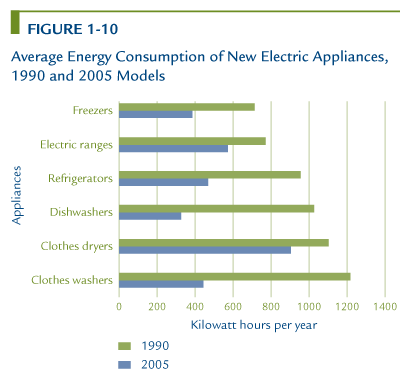
The change in residential energy use between 1990 and 2005 and the estimated energy savings due to energy efficiency measures are shown in Figure 1-8. Overall energy efficiency upgrades – including improvements to the thermal envelope (insulations, windows, etc.) and more energy-efficient appliances, furnaces and lighting – resulted in significant monetary savings for each Canadian household. The 25 percent improvement in energy efficiency between 1990 and 2005 translated into $6.1 billion in energy savings in 2005. Figure 1-9 shows how energy consumption differs for houses built in different periods, reflecting improvements in building construction. Figure 1-10 shows how average energy consumption of new appliances has improved, by comparing 1990 and 2005 models.
NRCan carries out the following initiatives to increase energy efficiency in the residential sector:
- ecoENERGY Retrofit – Homes
- ecoENERGY for Buildings and Houses
- Clean Energy Systems for Buildings and Communities
- ecoENERGY for Equipment (see Chapter 2)
Trends in Commercial/Institutional Sector
Energy Use and Greenhouse Gas Emissions
The commercial/institutional sector includes activity related to trade, finance, real estate, public administration, education and commercial services, including tourism. This sector uses energy mainly for space and water heating, operation of auxiliary equipment, space cooling, lighting, motive power for such services as pumping and ventilation in buildings, and street lighting.
In 2005, the commercial/institutional sector accounted for 14 percent (1153 PJ) of secondary energy use and 13 percent (65.3 Mt) of GHG emissions in Canada. Between 1990 and 2005, commercial/institutional energy use (including street lighting) increased by 33 percent, or 286 PJ. However, GHG emissions from the sector rose by 37 percent in the same period. The increase in use of GHG-intensive fuels, such as heavy oil and light fuel oil, explains why GHG emissions grew at a faster pace than energy use.
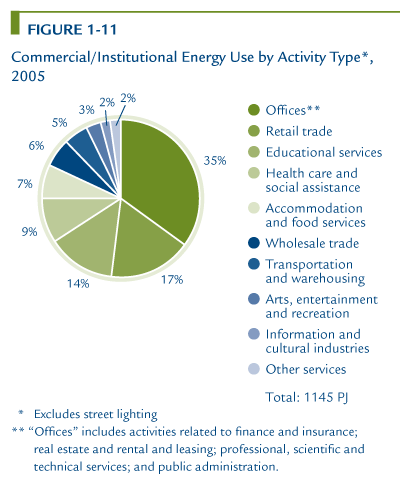
To highlight energy use in commercial/institutional activities, the following analysis excludes energy use for street lighting. The commercial/institutional sector comprises many activity types (see Figure 1-11). In 2005, offices accounted for 35 percent of the sector’s energy demand. Retail trade, educational services, health care and social assistance, and accommodation and food services accounted for another 47 percent of that demand. NRCan initiatives address all major activity types.
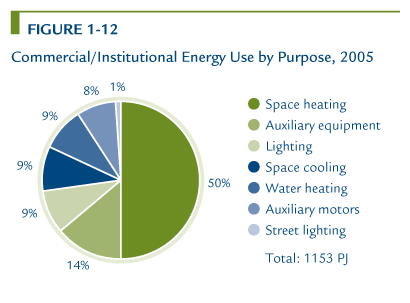
Energy is used for six purposes in commercial/institutional activities. As illustrated in Figure 1-12, in 2005, the largest of these was space heating, which accounted for more than half of energy use in the sector. Five of the remaining six uses of energy accounted for between 8 and 14 percent of energy demand in the sector.
Five main factors influenced commercial/institutional energy use between 1990 and 2005 – activity, weather, structure, service level and energy efficiency effect:
- Activity – More floor space increased energy use in the sector by 28 percent and caused a 247-PJ increase in energy use.
- Weather – The winter of 2005 was similar to the winter of 1990, but the summer was warmer than in 1990. The net result was a 3 percent increase in energy use (25 PJ) for space cooling.
- Structure – The impact of structural changes (mix of building types) was marginal but produced a decrease of 1 PJ in energy use.
- Service level – An increase in the service level of auxiliary equipment (e.g. computers, photocopiers) and space cooling caused an 11 percent increase in energy use (92 PJ).
- Energy efficiency effect – A 9 percent improvement in energy efficiency saved 75 PJ of energy.
Energy Efficiency
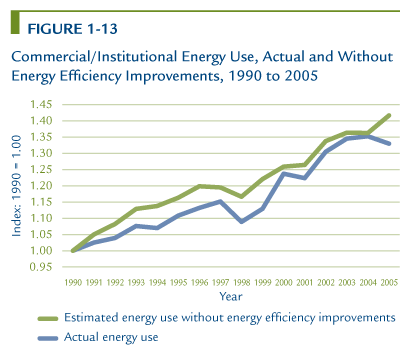
Gains in energy efficiency were made through improvements to the thermal envelope of buildings (insulation, windows, etc.) and increased efficiency of energy-consuming items, such as furnaces, auxiliary equipment and lighting, which slowed down the rate of increase in energy use. Without improvements in energy efficiency, energy use in the commercial/institutional sector would have increased by 41 percent. However, between 1990 and 2005, actual energy use increased by only 32 percent, resulting in energy savings of $1.6 billion in 2005. The change in energy use between 1990 and 2005, as well as the estimated energy savings due to improvements energy efficiency, are shown in Figure 1-13.
NRCan carries out the following initiatives to increase energy efficiency in the commercial/institutional sector:
- ecoENERGY Retrofit – Small and Medium Organizations
- ecoENERGY for Buildings and Houses
- Clean Energy Systems for Buildings and Communities
- ecoENERGY for Equipment (See Chapter 2)
Trends in Industrial Sector
Energy Use and Greenhouse Gas Emissions
The industrial sector includes all manufacturing industries, all mining activities (including oil and gas extraction), forestry and construction. However, it excludes electricity generation. This sector uses energy in industrial processes as a source of motive power and to produce heat or generate steam.
Overall, industrial energy demand in 2005 accounted for 38 percent (3209 PJ) of secondary energy use and 33 percent (164 Mt) of GHG emissions (including electricity-related emissions). Between 1990 and 2005, actual industrial energy use increased by 18 percent (488 PJ). This increase was caused by a 44 percent increase in industrial activity, measured as a combination of physical units of production, gross output and DACs.
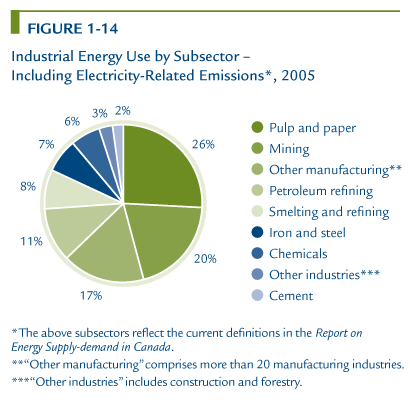
In the industrial sector, energy was consumed primarily in pulp and paper production, mining, petroleum refining, and in the smelting and refining industries. Pulp and paper production alone accounted for approximately 26 percent of total industrial energy demand in 2005 (see Figure 1-14).
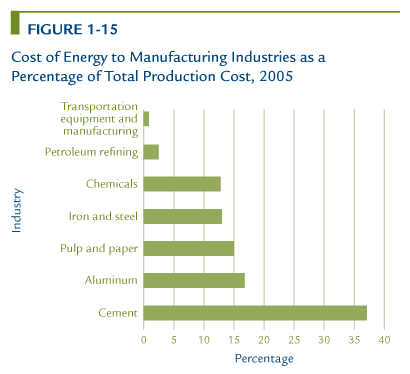
In most industries, energy purchases accounted for only a small portion of total expenditures. However, for some relatively energy-intensive industries – cement, aluminium, pulp and paper, iron and steel, and chemicals – this share was higher than 12 percent (see Figure 1-15). For cement, in particular, the share was as high as 37 percent.
Between 1990 and 2005, industrial GHG emissions, including electricity-related emissions, increased by 16 percent. Excluding electricity-related emissions, industrial GHG emissions increased by 8 percent. Most of this increase in direct GHG emissions occurred in the upstream oil and gas industry. The mining, manufacturing and construction industries, however, achieved a 9 percent decrease in GHG emissions.
Three main factors influenced industrial energy use between 1990 and 2005 – activity, structure and energy efficiency effect:
- Activity – Increases in the physical units of production, gross output and DACs contributed to a 43 percent increase in industrial activity, resulting in a 1166-PJ increase in energy use.
- Structure – The shift in the mix of activity toward less energy-intensive industries caused a 331-PJ decrease in energy use.
- Energy efficiency effect – Owing to a 13 percent improvement in energy efficiency, the industrial sector avoided 347 PJ of energy use.
Energy Efficiency
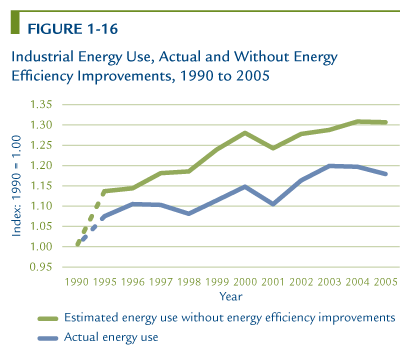
The change in energy use between 1990 and 2005 and the estimated energy savings attributed to energy efficiency are shown in Figure 1-16.
Energy efficiency improvements in the form of more efficient capital and management practices are important factors in managing energy use and decreasing energy intensity. Between 1990 and 2005, energy efficiency in the industrial sector improved 13 percent. In 2005, Canadian industry saved $3.9 billion in energy costs. This gain was largely the result of improvements in energy intensity, representing the shift toward less energy-intensive activities. However, the energy savings from the energy efficiency improvements made by some industries were offset by increases in consumption by the upstream oil and gas, fertilizer and forestry subsectors.
NRCan carries out the following initiatives to increase energy efficiency in the industrial sector:
- ecoENERGY Retrofit – Small and Medium Organizations
- ecoENERGY for Industry
- Clean Energy Systems for Industry
- ecoENERGY for Equipment (see Chapter 2)
Trends in Transportation
Energy Use and Greenhouse Gas Emissions
In 2005, transportation was second to the industrial sector in terms of energy use, accounting for 30 percent (2502 PJ) of Canada’s total secondary energy use and the largest portion of Canadian end-use GHG emissions at 36 percent (177.5 Mt). Transportation accounts for a greater share of GHG emissions because the main fuels used by the sector are more GHG-intensive than those used in other sectors of the economy.
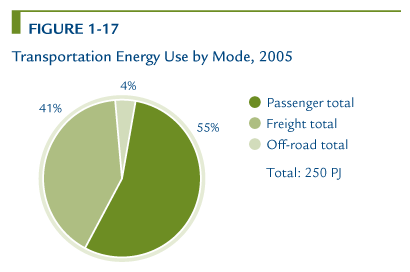
The transportation sector consists of three subsectors: passenger, freight and off-road. In 2005, passenger and freight transportation accounted for 55 percent and 41 percent of transportation energy use respectively, while off-road represented only 4 percent (see Figure 1-17). Owing to limitations in the available data and the small percentage it accounts for, the off-road subsector is not analysed in further detail.
The passenger subsector has three modes: road, rail and air. The freight subsector, as defined by NRCan, is composed of road, rail, air and marine modes. Within these two subsectors, road transport uses the most energy, accounting for 78 percent of total transportation energy use in 2005.
All of NRCan’s transportation energy use programs focus on the energy used in road transportation. Total transportation energy use increased by 33 percent (624 PJ) between 1990 and 2005. Within the transportation sector, passenger transportation energy use increased by 16 percent (188 PJ), while freight transportation energy use increased by 61 percent (391 PJ).
Three main factors influenced transportation energy use between 1990 and 2005 – activity, structure, and energy efficiency effect:
- Activity – Increases in population, air transportation and economic activity (e.g. free trade) caused increased transportation activity.5 The change in activity increased transportation energy use by 40 percent (750 PJ). Contributing to this increase were the freight and passenger segments, which increased by 52 and 48 percent respectively.
- Structure – Shifts between modes of transport within both the freight and passenger segments caused an increase of 10 percent in transportation energy use (187 PJ). Specifically, an increase in international trade and customer requirements for just-in-time delivery and the popularity of minivans and sport utility vehicles (SUVs) contributed to a rise in energy use.
- Energy efficiency effect – Improvements in the energy efficiency of passenger and freight transport decreased energy use by 19 percent (352 PJ).
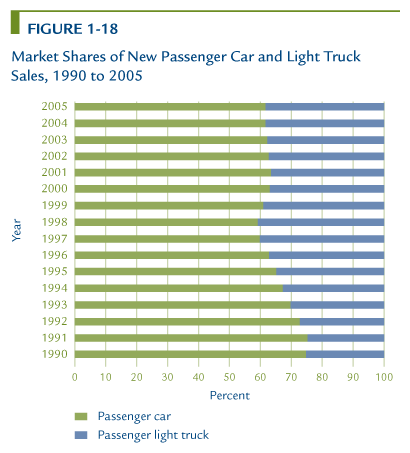
Figure 1-18 shows how the market share of new light trucks increased in the 1990s, reflecting the increase in popularity of minivans and SUVs. Recently, however, this trend seems to have stabilized, with the share of light trucks remaining steady over the past few years. The higher share of heavier and more powerful passenger vehicles has had a significant effect on the increase in passenger energy use.
Energy Efficiency
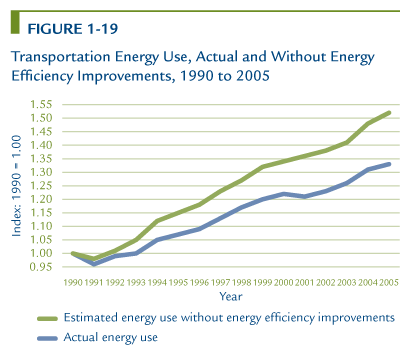
Without improvements in energy efficiency, increases attributable to activity and structure would have led to an increase in transportation energy use of 50 percent. However, between 1990 and 2005, actual energy use increased by only 33 percent. During this period, energy efficiency in the transportation sector improved by 19 percent, leading to a savings of $8.5 billion in 2005. This change in energy use between 1990 and 2005 and the estimated energy savings due to energy efficiency improvements are shown in Figure 1-19.
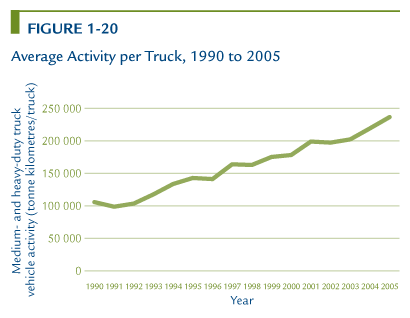
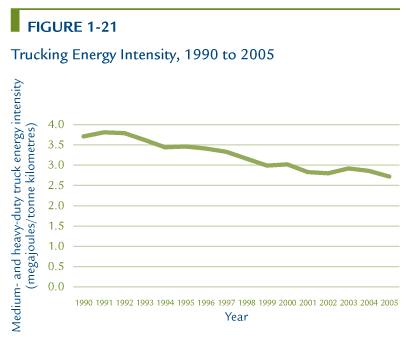
Figures 1-20 and 1-21 illustrate an improvement in trucking energy intensity despite an increase in average activity from 1990 to 2005. Improved fleet practices, caused by an increase in the competitiveness of the transportation sector and by the introduction of electronic engines, have improved fuel efficiency in medium- and heavy-duty trucks.
NRCan carries out the following initiatives to increase the efficiency of motor vehicle use:
- ecoENERGY for Personal Vehicles
- ecoENERGY for Fleets
- Clean Transportation Energy
Trends in Alternative and Renewable Fuels
Alternative and Renewable Fuels
Alternative fuels are fuels used for transportation other than petroleum-based gasoline and diesel. Some alternative transportation fuels, such as ethanol and biodiesel, are renewable; others, such as propane and natural gas, are non-renewable. Other possible alternative transportation fuels include next-generation biofuels, coal-to-liquids, electricity and hydrogen.
“Renewable fuel” is a broad term covering a range of fuels made from renewable energy sources that are naturally replenished in a relatively short period. The sources include biomass, hydropower, geothermal energy, wind energy and solar energy.
Biofuels is a well-known category of renewable fuel and can be produced from a variety of sources. Two commercially available biofuels are ethanol and biodiesel. Conventional ethanol is produced from sugars or starches, and biodiesel production typically uses vegetable oils and animal fats. In Canada, ethanol is typically produced from corn and wheat, while canola oil, soy oil and tallow are relevant biodiesel feedstocks.
Gasoline vehicles manufactured since the 1980s can use up to 10 percent ethanol in gasoline, and many diesel vehicle manufacturers include the use of 5 percent or higher biodiesel blends. Under development are next-generation biofuels, such as cellulosic ethanol. These biofuels could be made from non-conventional sources, such as agricultural residues, forest residues and waste materials.
Renewable Fuels Production
Renewable fuels production in Canada has increased since the emergence of ethanol in Manitoba in the 1980s. Between 2000 and 2006, domestic renewable fuel production capacity increased by more than 200 percent, from 207 million litres to 656 million litres annually. For 2008, ethanol production is estimated to be 1.3 billion litres.
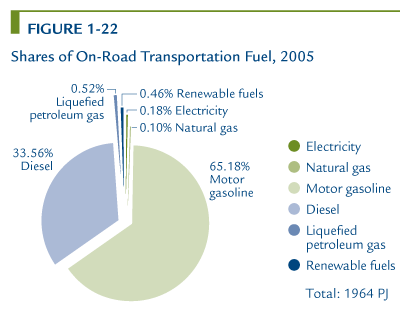
In 2005, renewable fuels used in the transportation sector represented less than 0.5 percent of fuel used, as shown in Figure 1-22. The renewable fuel consumed was predominately ethanol blended with gasoline in lower-level ethanol blends.
The federal regulation being developed will require an average annual renewable fuel content of at least 5 percent based on the volume of the gasoline pool, commencing in 2010, and at least 2 percent renewable content in the distillate pool by 2012.
NRCan carries out initiatives to increase the use and production of renewable and alternative fuels under the following programs:
- ecoENERGY for Biofuels
- Ethanol Expansion Program
- Sustainable Development Technology Canada’s NextGen Biofuels FundTM
² Data in this chapter are presented for 1990–2005. Readers are encouraged to consult the Office of Energy Efficiency Web site to view data updates as they become available.
3 One petajoule equals 1 × 10¹⁵ joules.
4 Based on the OEE Index.
5 Measured as passenger-kilometres for passenger transportation and tonne-kilometres for freight transportation.