
Natural Resources Canada
www.nrcan.gc.ca
Common menu bar links
Office of Energy Efficiency Links
Office of Energy Efficiency
Menu
Canadian Vehicle Survey 2007 Summary Report
Chapter 1. Canada’s on-road vehicle fleet
Canada’s transportation sector includes activities related to the movement of passengers and freight by road, rail, water and air. In 2006, the sector’s energy consumption accounted for almost 30 percent of total secondary energy use in Canada. The focus of the Canadian Vehicle Survey (CVS) is Canada’s on-road vehicle fleet and its characteristics.
The following section describes Canada’s on-road vehicle fleet, its use and its fuel consumption according to CVS data.
1.1 Number of vehicles
In 2007, there were 19 710 912 vehicles in Canada.¹ As shown in Table 1.1, vehicles can be divided into three categories: light vehicles, medium trucks and heavy trucks. In this report and for analysis purposes, the three categories are defined as follows:
- light vehicles: gross vehicle weight less than 4.5 tonnes (t)
- medium trucks: gross vehicle weight between 4.5 and 15 t
- heavy trucks: gross vehicle weight of 15 t or more
Table 1.1 Number of vehicles in Canada by vehicle type, 2000–2007
| Year | Light vehicles | Medium trucks | Heavy trucks | Total |
|---|---|---|---|---|
| Number of vehicles | ||||
| 2000 | 16 642 140 A | 319 500 A | 255 503 A | 17 217 143 A |
| 2001 | 16 790 536 A | 330 043 A | 253 648 A | 17 374 227 A |
| 2002 | 17 299 423 A | 315 424 A | 268 411 A | 17 883 258 A |
| 2003 | 17 561 499 A | 321 878 A | 278 848 A | 18 148 225 A |
| 2004 | 17 782 719 A | 322 555 A | 279 078 A | 18 162 924 A |
| 2005 | 18 134 739 A | 325 939 A | 295 463 A | 18 756 141 A |
| 2006 | 18 536 955 A | 331 667 A | 305 947 A | 19 174 569 A |
| 2007 | 19 003 427 A | 392 608 A | 314 877 A | 19 710 912 A |
The letter to the right of each estimate indicates its quality: A – Excellent, B – Very good, C – Good,
D – Acceptable, E – Use with caution and F – Too unreliable to be published.
Due to rounding, the numbers in the tables may not add up, and some data may differ slightly from one table to the next.
The light vehicle category is the largest, representing 96 percent of Canada’s on-road vehicle fleet in 2007.
The quarterly data highlight significant seasonal variations in the number of vehicles travelling on Canadian roads and in the use of these vehicles. The number of vehicles tends to be slightly lower during the coldest months, from January to March (first quarter, or Q1). During the summer months (Q2 and Q3), the number of vehicles driven was slightly higher than the numbers for the other two quarters of 2007. This could be explained by the fact that some vehicles are put away for part of the year, usually in the colder months. Figure 1.1 shows the quarterly estimated number of vehicles by vehicle type from 2000 to 2007.

1.2 Principal characteristics of vehicles: Age and fuel type
The age of Canada’s on-road vehicle fleet sheds light on various issues. For example, a vehicle’s age is an important variable in analysing its use and can play a significant role in determining its fuel efficiency.
Figure 1.2 shows the distribution of vehicles in the CVS based on age. Medium trucks were the oldest vehicles, with almost 40 percent of the fleet being over 10 years old. The heavy truck segment was the youngest, with almost 30 percent of the fleet being less than two years old.
In 2007, gasoline and diesel remained the most frequently used fuels in the country. More than 99 percent of vehicles used one of these fuels. In the CVS, the gasoline category includes three grades of this fuel and gasoline-ethanol blends. Low-level ethanol blends are suitable for most vehicles and are available at more than 1100 service stations across Canada. Other types of fuel used by Canadians included propane and natural gas.² These alternative fuels offer several environmental benefits. For example, they can burn more cleanly and completely than gasoline and diesel, producing fewer greenhouse gases.
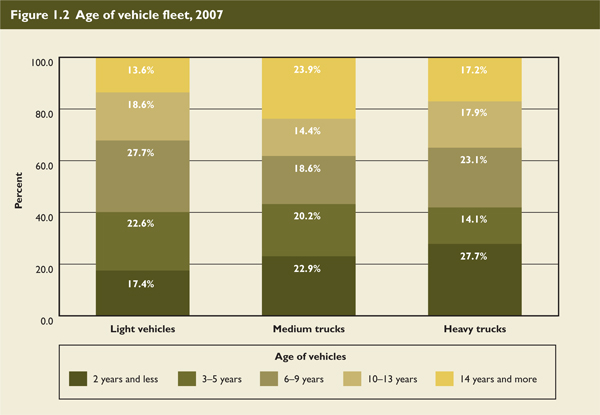
Table 1.2 shows the number of vehicles in Canada in 2007 according to fuel type. Gasoline dominated the light vehicle category, with 97 percent of vehicles using this fuel. Diesel remained the primary fuel for heavy trucks. As well, 72 percent of medium trucks used diesel, while the rest of the fleet used gasoline.
Table 1.2 Number of vehicles in Canada by vehicle type and fuel type, 2007
| Fuel type | Light vehicles | Medium trucks | Heavy trucks | Total |
|---|---|---|---|---|
| Number of vehicles | ||||
| Gasoline | 18 362 635 A | 104 332 E | – F | 18 469 344 A |
| Diesel | 576 204 B | 283 974 C | 311 939 B | 1 172 118 C |
| Other* | 64 587 E | – F | – F | 69 450 D |
| Total | 19 003 427 A | 392 608 B | 314 877 B | 19 710 912 A |
*Other includes electric, propane, natural gas and ethanol fuel types.
The letter to the right of each estimate indicates its quality: A – Excellent, B – Very good, C – Good,
D – Acceptable, E – Use with caution and F – Too unreliable to be published.
Due to rounding, the numbers in the tables may not add up, and some data may differ slightly from one table to the next.
1.3 Vehicle use
In 2007, Canadian vehicles travelled more than 332 billion kilometres. Based on the information provided in Table 1.3, 90 percent of the total distance travelled was by light vehicles, 2.5 percent was by medium trucks and 7.2 percent was by heavy trucks in 2007.
Table 1.3 Vehicle-kilometres travelled in Canada by vehicle type, 2000–2007
| Year | Light vehicles | Medium trucks | Heavy trucks | Total |
|---|---|---|---|---|
| Vehicle-kilometres (millions) | ||||
| 2000 | 281 985 A | 5 930 A | 20 716 A | 308 631 A |
| 2001 | 283 380 A | 6 476 A | 18 577 A | 308 434 A |
| 2002 | 290 320 A | 5 440 A | 18 167 A | 313 927 A |
| 2003 | 286 803 A | 6 184 A | 18 613 A | 311 599 A |
| 2004 | 285 164 A | 7 001 B | 20 829 A | 312 994 A |
| 2005 | 289 717 A | 6 195 B | 21 601 A | 317 512 A |
| 2006 | 296 871 A | 7 438 B | 21 837 A | 326 145 A |
| 2007 | 300 203 A | 8 150 B | 23 922 A | 332 275 A |
The letter to the right of each estimate indicates its quality: A – Excellent, B – Very good, C – Good,
D – Acceptable, E – Use with caution and F – Too unreliable to be published.
Due to rounding, the numbers in the tables may not add up, and some data may differ slightly from one table to the next.
From 2000 to 2007, light vehicles’ share of total vehicle-kilometres travelled decreased by slightly more than one percentage point. Although the total distance travelled by light vehicles increased by 6 percent over the same period, the distance travelled by medium trucks and heavy trucks increased more (37 percent and 15 percent respectively).
The number of passenger-kilometres reveals a lot about Canadians’ driving habits, e.g. the occupancy rates. In 2007, over 524 billion passenger-kilometres were travelled, representing a slight decrease from the previous two years. This information is presented in Table 1.4, with figures dating back to 2000.
Table 1.4 Passenger-kilometres travelled in Canada by vehicle type, 2000–2007
| Year | Light vehicles | Medium trucks | Heavy trucks | Total |
|---|---|---|---|---|
| Passenger-kilometres (millions) | ||||
| 2000 | 475 074 A | n/a | n/a | 475 074 A |
| 2001 | 460 624 A | 9 296 C | 19 761 B | 489 681 B |
| 2002 | 470 580 A | 7 552 B | 20 414 B | 498 545 B |
| 2003 | 463 466 A | 8 911 D | 20 033 B | 492 409 B |
| 2004 | 471 164 A | 9 275 B | 22 687 A | 503 125 A |
| 2005 | 496 961 A | 7 822 B | 24 407 A | 529 189 A |
| 2006 | 491 756 A | 9 661 B | 23 899 A | 525 316 A |
| 2007 | 486 932 A | 11 151 B | 26 367 A | 524 450 A |
The letter to the right of each estimate indicates its quality: A – Excellent, B – Very good, C – Good,
D – Acceptable, E – Use with caution and F – Too unreliable to be published.
Due to rounding, the numbers in the tables may not add up, and some data may differ slightly from one table to the next.
A comparison of passenger-kilometres with vehicle-kilometres is found in Figure 1.3.
Another area of interest is the intensity with which Canadians use their vehicles, as demonstrated by two indicators:
- the per capita number of vehicle- and passenger-kilometres travelled
- the average number of vehicle-kilometres travelled per vehicle
In 2007, there were 15 797 vehicle-kilometres and 25 623 passenger-kilometres travelled per light vehicle in Canada. In addition to these data, the survey shows that in 2007, each medium truck and heavy truck travelled an average annual distance of 20 758 kilometres (km) and 75 971 km respectively. From 2000 to 2007, the average distance travelled per light vehicle steadily decreased (by 7 percent), as shown in Figure 1.4.


1.4 Vehicle fuel consumption
Table 1.5 shows gasoline and diesel consumption in 2007 by vehicle type. The total consumption in 2007 was 32 billion litres of gasoline and 11 billion litres of diesel.
Table 1.5 Fuel consumption, 2007
| Fuel type | Light vehicles | Medium trucks | Heavy trucks | Total |
|---|---|---|---|---|
| Fuel consumed (millions of litres) | ||||
| Gasoline | 31 305.0 B | 319.2 D | – F | 31 647.3 C |
| Diesel | 1 292.1 E | 1 554.5 B | 8 218.8 A | 11 065.5 B |
The letter to the right of each estimate indicates its quality: A – Excellent, B – Very good, C – Good,
D – Acceptable, E – Use with caution and F – Too unreliable to be published.
Due to rounding, the numbers in the tables may not add up, and some data may differ slightly from one table to the next.
In conjunction with fuel consumption data, fuel efficiency by vehicle type can be calculated. Table 1.6 shows fuel consumption rates based on vehicle type and fuel type for 2007. Light vehicles averaged 10.8 litres per 100 km (L/100 km) (gasoline). Medium trucks averaged 21.7 L/100 km (gasoline) and 23.5 L/100 km (diesel). Heavy trucks averaged 34.5 L/100 km (diesel). The analysis following in chapters 3 and 4 shows that various factors affect the fuel consumption rates of light vehicles and medium and heavy trucks.
Table 1.6 also shows the increase in fuel efficiency since 2000. Light vehicles, already the most fuel-efficient class of vehicle, were 4 percent more fuel efficient in 2007. Medium trucks also made improvements in fuel efficiency in the gasoline and diesel categories, by 9 percent and 7 percent respectively. Heavy trucks witnessed a substantial 21 percent increase in fuel efficiency from 2000 to 2007. This increase can be attributed to such factors as electronic engines, improved vehicle specifications, advanced vehicle aerodynamics and on-board monitoring.³ Furthermore, lighter loads can have an impact on fuel efficiency. However, the 2007 CVS does not have load data information at this time.
Table 1.6 Fuel consumption rates by vehicle type and fuel type, 2000 and 2007
| Year | 2000 | 2007 | 2000 | 2007 |
|---|---|---|---|---|
| Type of vehicle | Gasoline (L/100 km) |
Diesel (L/100 km) |
||
| Light vehicles | 11.2 A | 10.8 A | n/a | 12.3 C |
| Medium trucks | 23.8 B | 21.7 A | 25.4 A | 23.5 A |
| Heavy trucks | n/a | 31.5 B | 43.5 A | 34.5 A |
The letter to the right of each estimate indicates its quality: A – Excellent, B – Very good, C – Good,
D – Acceptable, E – Use with caution and F – Too unreliable to be published.
Due to rounding, the numbers in the tables may not add up, and some data may differ slightly from one table to the next.
The CVS findings in Figure 1.5 illustrate the relationship between light-vehicle travel and gas prices. During the coldest months (Q1), gas prices and vehicle-kilometres dropped as people drove less during the colder months. During the warmer months (Q3), there was a rise in gas prices and vehicle-kilometres driven. As a result, there was some correlation between vehicle-kilometres driven and gas prices.

On-road vehicle fuel efficiency is another factor that could be related to quarterly fluctuations in gas consumption. Gas consumption is affected not only by the distance travelled and driver behaviour but also by the temperature – through idling, as shown in the Fuel Consumption Guide produced annually by Natural Resources Canada.4
Figure 1.6 shows that the fuel efficiency of gasoline-powered light vehicles was worse during the colder months (first and fourth quarters). The differences could be attributed to various factors, such as people letting their vehicles idle in the cold weather either to warm up the engine or as a result of more congestion due to unplowed roads and poor weather conditions.

Figure 1.7 shows CVS estimates for the fuel efficiency of diesel-powered medium and heavy trucks for the four quarters of 2007. Diesel consumption rates did not vary significantly between quarters and thus may not be related to seasonal temperatures.

¹ This figure represents the number of in-scope vehicles. The number of in-scope vehicles is an estimate of the average number of vehicles registered during the quarter based on the registration lists from jurisdictions and survey responses. This estimate may differ from the number of vehicles on the registration lists because it includes all survey findings. The number of in-scope vehicles includes vehicles used and those not used on the roads during the reference period.
² For more information on alternative fuels, visit oee.nrcan-rncan.gc.ca.
³ oee.nrcan-rncan.gc.ca/transportation/business/documents/case-studies/fuel-effic-benchm.cfm
4 For more information on the Fuel Consumption Guide, visit ecoaction.gc.ca/vehicles.