
Natural Resources Canada
www.nrcan.gc.ca
Common menu bar links
Office of Energy Efficiency Links
Office of Energy Efficiency
Menu
Energy Consumption of Major Household Appliances Shipped in Canada – Trends for 1990–2005
4 ELECTRIC RANGES
4.1 2005 Market Snapshot
In 2005, 58.8 percent of the electric ranges shipped in Canada were self-cleaning units. The shipment-weighted average annual unit energy consumption (UEC) for self-cleaning ranges was 558 kilowatt hours (kWh), compared with 593 kWh for regular electric ranges. Even though the energy consumption rating takes into account the energy used during the self-cleaning cycles (based originally on 11 cleanings per year but recently reduced to 4), these ranges use less energy than the regular electric ranges. That is because their ovens are generally better insulated and the door seals are better than those in the non-self-cleaning ovens. This means that the self-cleaning units lose less heat through the oven door.
Electric ranges typically make up 92 percent of the market; gas ranges constitute the remainder.31
4.2 Distribution of Shipments
4.2.1 Distribution by Type
As illustrated in Table 4.1 and Figure 4.1, in 1990, self-cleaning electric ranges accounted for less than one quarter (22.9 percent) of all electric ranges available on the market. By 2005, self-cleaning ranges had increased in popularity, with market share increasing to 58.8 percent. This represents a 36 percent increase since 1990, or an annual growth rate of 2.4 percent.
In contrast, the market share of electric ranges that were not self-cleaning decreased by 36 percent, dropping from 77.1 percent in 1990 to 41.2 percent in 2005.
As noted above, self-cleaning ovens are usually better insulated than non-self-cleaning ones, resulting in less heat loss and less energy consumption.
TABLE 4.1
Distribution of Electric Ranges by Type
| Model Year | Non-Self-Cleaning | Self-Cleaning |
|---|---|---|
| (%) | (%) | |
| 1990 | 77.1 | 22.9 |
| 1991 | 71.3 | 28.7 |
| 1992 | 71.6 | 28.4 |
| 1993 | 70.1 | 29.9 |
| 1994 | 69.4 | 30.6 |
| 1995 | 68.3 | 31.7 |
| 1996 | 66.6 | 33.4 |
| 1997 | 64.1 | 35.9 |
| 1998 | 59.2 | 40.8 |
| 1999 | 59.4 | 40.6 |
| 2000 | 55.6 | 44.4 |
| 2001 | 47.8 | 52.2 |
| 2002 | 42.7 | 57.3 |
| 2003 | 44.9 | 55.1 |
| 2004 | 42.3 | 57.7 |
| 2005 | 41.2 | 58.8 |
| Total Change |
-35.9% | +35.9% |

Click here to view larger image
4.2.2 Distribution by Type, by Region/Province
Self-cleaning ranges substantially increased their market share during the study period, with a national average of 58.8 percent in 2005. Figure 4.2 demonstrates the proportion of self-cleaning versus non-self-cleaning ranges throughout the country for 2004 and 2005. It shows a slight increase in self-cleaning ranges from the previous year throughout the regions, with the exception of Ontario, where shipments of self-cleaning ranges decreased slightly.

Click here to view larger image
* For more information, see Table D.24 in Appendix D, "Detailed Tables."
4.2.3 Distribution by Average Annual Unit Energy Consumption
Table 4.2 and Figure 4.3 demonstrate that in 1990, the electric ranges that dominated the market (73.2 percent) consumed between 750 and 850 kWh per year. In 2005, the market share of electric ranges in these categories fell to 13.7 percent. By 2003, there was a considerable increase in the market share of electric ranges that consumed less than 600 kWh, reaching 71.1 percent in 2005. This is due to an energy-consumption standard introduced in October 2003.32 Testing to the new standard provided a new method for calculating energy consumption and resulted in a lower EnerGuide rating in kilowatt hours per year. Several important changes were made to the calculation for the rating, including the number of times the self-cleaning cycle is used; this was lowered from 11 times per year to 4 because consumers are not using these appliances as much as they did in the past.
TABLE 4.2
Distribution of Electric Ranges by Average Annual Unit Energy Consumption
| Model Year |
kWh/yr | |||||||
|---|---|---|---|---|---|---|---|---|
| <500 | 500–599.9 | 600–649.9 | 650–699.9 | 700–749.9 | 750–799.9 | 800–849.9 | >850 | |
| (%) | (%) | (%) | (%) | (%) | (%) | (%) | (%) | |
| 1990 | 3.8 | 0.0 | 0.0 | 0.5 | 13.8 | 30.8 | 42.4 | 8.7 |
| 1991 | 0.0 | 0.0 | 0.0 | 0.8 | 15.9 | 27.6 | 54.0 | 1.8 |
| 1992 | 0.0 | 0.0 | 0.0 | 0.0 | 15.0 | 58.1 | 26.5 | 0.3 |
| 1993 | 0.0 | 0.0 | 0.0 | 0.1 | 18.4 | 42.8 | 38.5 | 0.2 |
| 1994 | 0.0 | 0.0 | 0.1 | 1.7 | 32.2 | 28.5 | 37.4 | 0.1 |
| 1995 | 0.0 | 0.0 | 0.1 | 3.3 | 35.0 | 22.5 | 39.2 | 0.0 |
| 1996 | 0.0 | 0.0 | 0.0 | 3.2 | 27.6 | 26.4 | 42.8 | 0.0 |
| 1997 | 0.0 | 0.0 | 0.0 | 3.6 | 27.6 | 29.0 | 39.8 | 0.0 |
| 1998 | 0.0 | 0.0 | 0.0 | 8.6 | 23.3 | 30.6 | 37.4 | 0.0 |
| 1999 | 0.0 | 0.0 | 0.0 | 15.3 | 28.2 | 31.6 | 24.9 | 0.0 |
| 2000 | 0.0 | 0.0 | 0.0 | 14.3 | 30.9 | 29.5 | 25.3 | 0.0 |
| 2001 | 0.0 | 0.0 | 0.0 | 15.0 | 27.3 | 29.2 | 28.5 | 0.0 |
| 2002 | 0.0 | 0.0 | 0.0 | 15.9 | 30.4 | 33.5 | 20.2 | 0.0 |
| 2003 | 12.5 | 5.4 | 0.4 | 7.9 | 30.0 | 27.3 | 16.5 | 0.0 |
| 2004 | 27.8 | 13.3 | 4.8 | 3.8 | 18.8 | 19.5 | 12.0 | 0.0 |
| 2005 | 44.9 | 26.2 | 4.6 | 2.6 | 8.1 | 7.8 | 5.9 | 0.0 |
| Total Change |
+41.1% | +26.2% | +4.6% | +2.1% | -5.7% | -23.0% | -36.5% | -8.7% |

Click here to view larger image
4.2.4 Distribution by Average Annual Unit Energy Consumption, by Region/Province
In 2005, 71.1 percent of all electric ranges shipped in Canada consumed less than 600 kWh per year, compared with 41.1 percent in 2004. Figure 4.4 shows that this was the tendency throughout the regions. As mentioned previously, a new testing method and energy-consumption standard was introduced in October 2003. Far more of the electric ranges shipped in 2005 were of models newly listed in the 2004 and 2005 EnerGuide appliance directories. Therefore, the proportion of models rated using this new testing standard was considerably higher than in 2004.

Click here to view larger image
* For more information, see Table D.25 in Appendix D, "Detailed Tables."
4.2.5 Distribution by Channel, by Region/Province
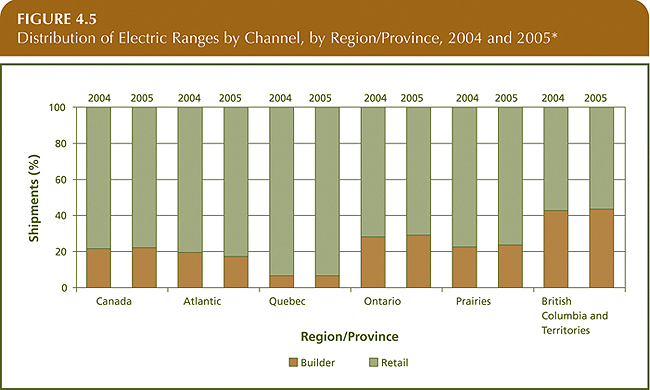
Figure 4.5 illustrates the proportion of electric ranges shipped for retail sales versus those shipped for the building trade, for 2004 and 2005. There was little change in proportion of retail versus builder shipments throughout the country between 2004 and 2005. British Columbia and the Territories still had a substantially larger builder shipment representation (43.5 percent) than the rest of the country, and Quebec had a somewhat lower share (6.5 percent).

Click here to view larger image
* For more information, see Table D.26 in Appendix D, "Detailed Tables."
4.3 Energy Consumption
4.3.1 Average Annual Unit Energy Consumption by Model Year
Between 1990 and 2002, the energy consumption of electric ranges remained relatively unchanged. The decrease in average annual UEC, as illustrated in Figure 4.6, was about 2 percent, or 16 kWh. However, from 2003 to 2005, the average annual UEC decreased substantially, from 756.0 to 572.5 kWh, due to a 2003 amendment to the minimum energy performance standards (MEPS), which is attributable to a new reference standard for electric ranges having been put into place in 2003. This resulted in the reduction of the annual energy consumption for all models. However, this reduction may not reflect any improvement in the energy efficiency of those models.

* For more information, see Table D.27 in Appendix D, "Detailed Tables."
4.3.2 Average Annual Unit Energy Consumption by Channel, by Region/Province
Figure 4.7 demonstrates the breakdown of the average annual UEC of electric ranges by retail shipments versus builder shipments, by region/province for 2004 and 2005. The chart shows that the average annual UEC decreased substantially in 2005 for retail and builder shipments. Also, in all regions, the average annual UEC remained lower for retail shipments than for builder shipments, but the gap between the two did become smaller.

Click here to view larger image
* For more information, see Table D.28 in Appendix D, "Detailed Tables."
4.4 Energy Savings
Figure 4.8 shows how much energy might have been consumed by electric ranges without the MEPS or general improvements in energy efficiency (top line) and how much energy they actually consumed (bottom line). Graphically, the gap between the two lines represents annual energy savings – on average, 0.02 petajoules (PJ) per year for 1992–2001 and 0.26 PJ per year for 2002–2005.

* For more information, see Table D.29 in Appendix D, "Detailed Tables."
The cumulative energy savings for electric ranges are shown in Figure 4.9. Cumulative energy savings grew slowly but steadily between 1994 and 2002, as annual energy savings began to accrue. The savings increased substantially from 2003 to 2005, due to a new testing method and energy consumption standard introduced in October 2003. Savings reached 1.17 PJ in 2005, taking into account the life expectancy factor of electric ranges (this calculation is explained further in Appendix A, "Methodology").

Electric Ranges Summary
By 2005, self-cleaning ranges had increased in popularity by 36 percent, with market share increasing to 58.8 percent. In 2005, the shipment-weighted average annual UEC for self-cleaning ranges was 558.0 kWh, compared with 593.2 kWh for regular electric ranges.
By 2005, 71.1 percent of electric ranges consumed less than 600 kWh per year, whereas in 1990, those that dominated the market consumed between 800 and 849 kWh (42.4 percent).
About 77.9 percent of all electric ranges were shipped for retail sales, whereas 22.1 percent were tagged for builder shipments. British Columbia and the Territories had a substantially larger builder shipment representation (43.5 percent) than the rest of the country, whereas Quebec had a somewhat lower share (6.5 percent).
Cumulative energy savings grew slowly but steadily between 1994 and 2002, as annual energy savings began to accrue. The savings increased substantially between 2003 and 2005 due to a new testing method and energy-consumption standard introduced in October 2003. Total energy savings for the study period reached 1.17 PJ (325.00 million kWh). Dollar savings for electric ranges for the study period were estimated to be $29 million (calculated at 9.2 cents/kWh).
31 Natural Resources Canada, EnerGuide Appliance Directory 2005 (Ottawa: February 2005), p.144.
32 Ibid.